29
/
en
AIzaSyAYiBZKx7MnpbEhh9jyipgxe19OcubqV5w
April 1, 2024
98876
Cambodia
KHM
true
2
1
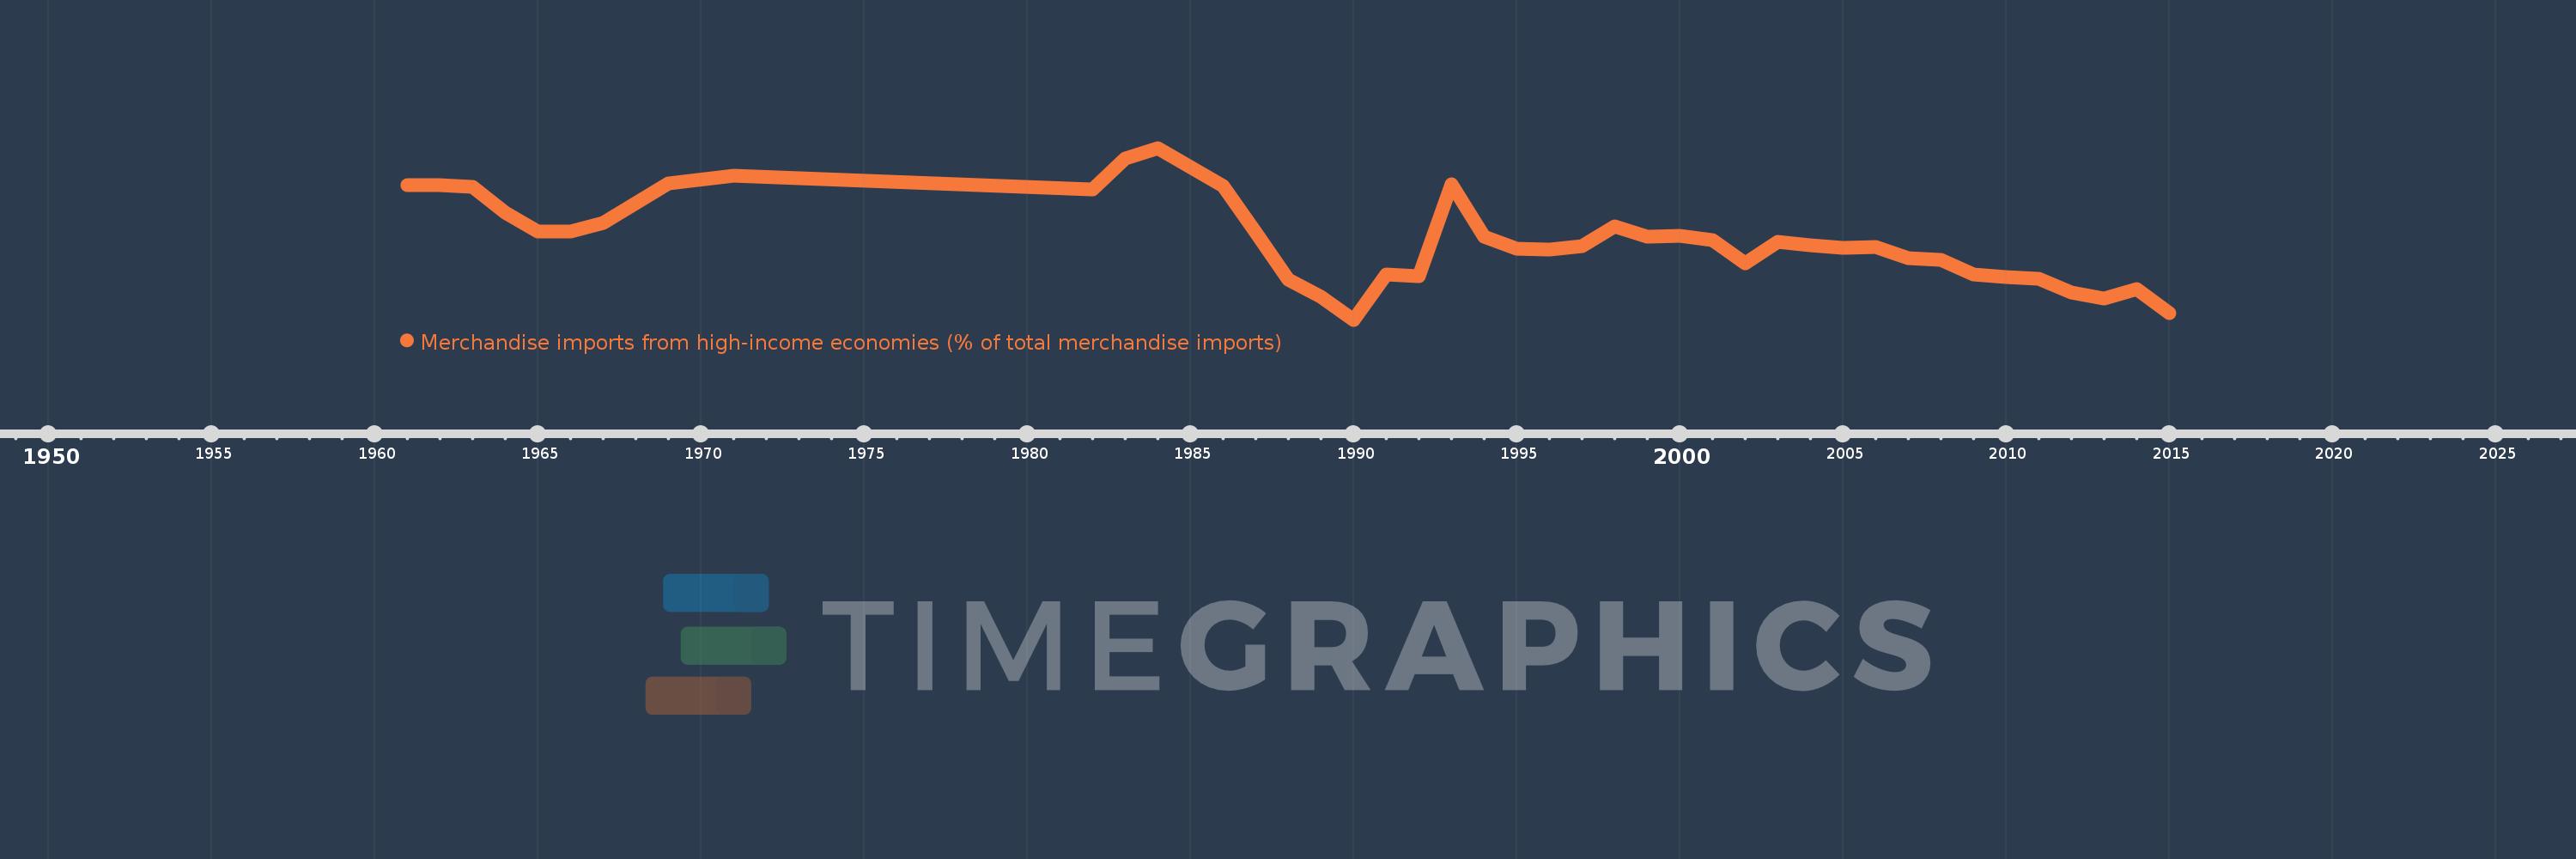
Merchandise imports from high-income economies (% of total merchandise imports)
2015,2014,2013,2012,2011,2010,2009,2008,2007,2006,2005,2004,2003,2002,2001,2000,1999,1998,1997,1996,1995,1994,1993,1992,1991,1990,1989,1988,1987,1986,1985,1984,1983,1982,1971,1969,1967,1966,1965,1964,1963,1962,1961
This statistics in other country:
AfghanistanAlbaniaAlgeriaAngolaAntigua and BarbudaArab WorldArgentinaArmeniaArubaAustraliaAustriaAzerbaijanBahamas, TheBahrainBangladeshBarbadosBelarusBelgiumBelizeBeninBermudaBoliviaBosnia and HerzegovinaBrazilBrunei DarussalamBulgariaBurkina FasoBurundiCabo VerdeCambodiaCameroonCanadaCaribbean small statesCentral African RepublicCentral Europe and the BalticsChadChileChinaColombiaComorosCongo, Dem. Rep.Congo, Rep.Costa RicaCote d'IvoireCroatiaCubaCyprusCzech RepublicDenmarkDjiboutiDominicaDominican RepublicEarly-demographic dividendEast Asia & PacificEast Asia & Pacific (excluding high income)East Asia & Pacific (IDA & IBRD countries)EcuadorEgypt, Arab Rep.El SalvadorEquatorial GuineaEstoniaEthiopiaEuro areaEurope & Central AsiaEurope & Central Asia (excluding high income)Europe & Central Asia (IDA & IBRD countries)European UnionFaroe IslandsFijiFinlandFragile and conflict affected situationsFranceFrench PolynesiaGabonGambia, TheGeorgiaGermanyGhanaGibraltarGreeceGreenlandGrenadaGuamGuatemalaGuineaGuinea-BissauGuyanaHaitiHeavily indebted poor countries (HIPC)High incomeHondurasHong Kong SAR, ChinaHungaryIBRD onlyIcelandIDA & IBRD totalIDA blendIDA onlyIDA totalIndiaIndonesiaIran, Islamic Rep.IraqIrelandIsraelItalyJamaicaJapanJordanKazakhstanKenyaKiribatiKorea, Dem. People’s Rep.Korea, Rep.KosovoKuwaitKyrgyz RepublicLao PDRLate-demographic dividendLatin America & Caribbean Latin America & Caribbean (excluding high income)Latin America & the Caribbean (IDA & IBRD countries)LatviaLeast developed countries: UN classificationLebanonLiberiaLibyaLithuaniaLow & middle incomeLow incomeLower middle incomeLuxembourgMacao SAR, ChinaMacedonia, FYRMadagascarMalawiMalaysiaMaldivesMaliMaltaMauritaniaMauritiusMexicoMiddle East & North AfricaMiddle East & North Africa (excluding high income)Middle East & North Africa (IDA & IBRD countries)Middle incomeMoldovaMongoliaMontenegroMoroccoMozambiqueMyanmarNauruNepalNetherlandsNew CaledoniaNew ZealandNicaraguaNigerNigeriaNorth AmericaNorwayOECD membersOmanOther small statesPacific island small statesPakistanPanamaPapua New GuineaParaguayPeruPhilippinesPolandPortugalPost-demographic dividendPre-demographic dividendQatarRomaniaRussian FederationRwandaSamoaSao Tome and PrincipeSaudi ArabiaSenegalSerbiaSeychellesSierra LeoneSingaporeSlovak RepublicSloveniaSmall statesSolomon IslandsSomaliaSouth AfricaSouth AsiaSouth Asia (IDA & IBRD)SpainSri LankaSt. Kitts and NevisSt. LuciaSt. Vincent and the GrenadinesSub-Saharan Africa Sub-Saharan Africa (excluding high income)Sub-Saharan Africa (IDA & IBRD countries)SudanSurinameSwedenSwitzerlandSyrian Arab RepublicTajikistanTanzaniaThailandTogoTongaTrinidad and TobagoTunisiaTurkeyTurkmenistanTuvaluUgandaUkraineUnited Arab EmiratesUnited KingdomUnited StatesUpper middle incomeUruguayUzbekistanVanuatuVenezuela, RBVietnamWorldYemen, Rep.ZambiaZimbabwe Timeline:
This timeline shows a graph from 1961 to 2015 of Cambodia. No data until 1960. Number of actual observations by date: 43.
Source name:
World Development Indicators
Source organization:
World Bank staff estimates based data from International Monetary Fund's Direction of Trade database.
Categories, topics:
Private Sector, Trade
Last updated:
apr 23, 2017
Indicators value changes by year
Minimum:
25.504
jan 1, 1990
Maximum:
97.649
jan 1, 1984
At the date of observation
Value
Absolute change
Change from previous value
jan 1, 1961
81.964
+81.964
0.0%
jan 1, 1962
81.996
+0.032
0.04%
jan 1, 1963
81.427
-0.569
-0.69%
jan 1, 1964
70.416
-11.011
-13.52%
jan 1, 1965
62.469
-7.947
-11.29%
jan 1, 1966
62.616
+0.147
0.24%
jan 1, 1967
66.324
+3.708
5.92%
jan 1, 1969
82.701
+16.377
24.69%
jan 1, 1971
85.858
+3.157
3.82%
jan 1, 1982
80.116
-5.742
-6.69%
jan 1, 1983
93.16
+13.044
16.28%
jan 1, 1984
97.649
+4.489
4.82%
jan 1, 1985
89.724
-7.925
-8.12%
jan 1, 1986
81.748
-7.976
-8.89%
jan 1, 1987
62.039
-19.709
-24.11%
jan 1, 1988
42.363
-19.675
-31.71%
jan 1, 1989
34.968
-7.396
-17.46%
jan 1, 1990
25.504
-9.464
-27.07%
jan 1, 1991
44.359
+18.856
73.93%
jan 1, 1992
43.717
-0.642
-1.45%
jan 1, 1993
82.47
+38.753
88.65%
jan 1, 1994
60.487
-21.982
-26.66%
jan 1, 1995
55.284
-5.204
-8.6%
jan 1, 1996
54.971
-0.312
-0.56%
jan 1, 1997
56.426
+1.455
2.65%
jan 1, 1998
64.712
+8.286
14.68%
jan 1, 1999
60.555
-4.157
-6.42%
jan 1, 2000
60.643
+0.088
0.14%
jan 1, 2001
59.007
-1.635
-2.7%
jan 1, 2002
49.207
-9.8
-16.61%
jan 1, 2003
58.2
+8.993
18.28%
jan 1, 2004
56.635
-1.565
-2.69%
jan 1, 2005
55.526
-1.109
-1.96%
jan 1, 2006
56.101
+0.576
1.04%
jan 1, 2007
51.397
-4.704
-8.38%
jan 1, 2008
50.469
-0.928
-1.81%
jan 1, 2009
44.575
-5.894
-11.68%
jan 1, 2010
43.488
-1.087
-2.44%
jan 1, 2011
42.761
-0.727
-1.67%
jan 1, 2012
37.067
-5.694
-13.32%
jan 1, 2013
34.478
-2.589
-6.98%
jan 1, 2014
38.457
+3.979
11.54%
jan 1, 2015
28.146
-10.311
-26.81%
Ranking of countries by current statistics by years


Comments: