29
/
en
AIzaSyAYiBZKx7MnpbEhh9jyipgxe19OcubqV5w
April 1, 2024
215532
Oman
OMN
true
2
1
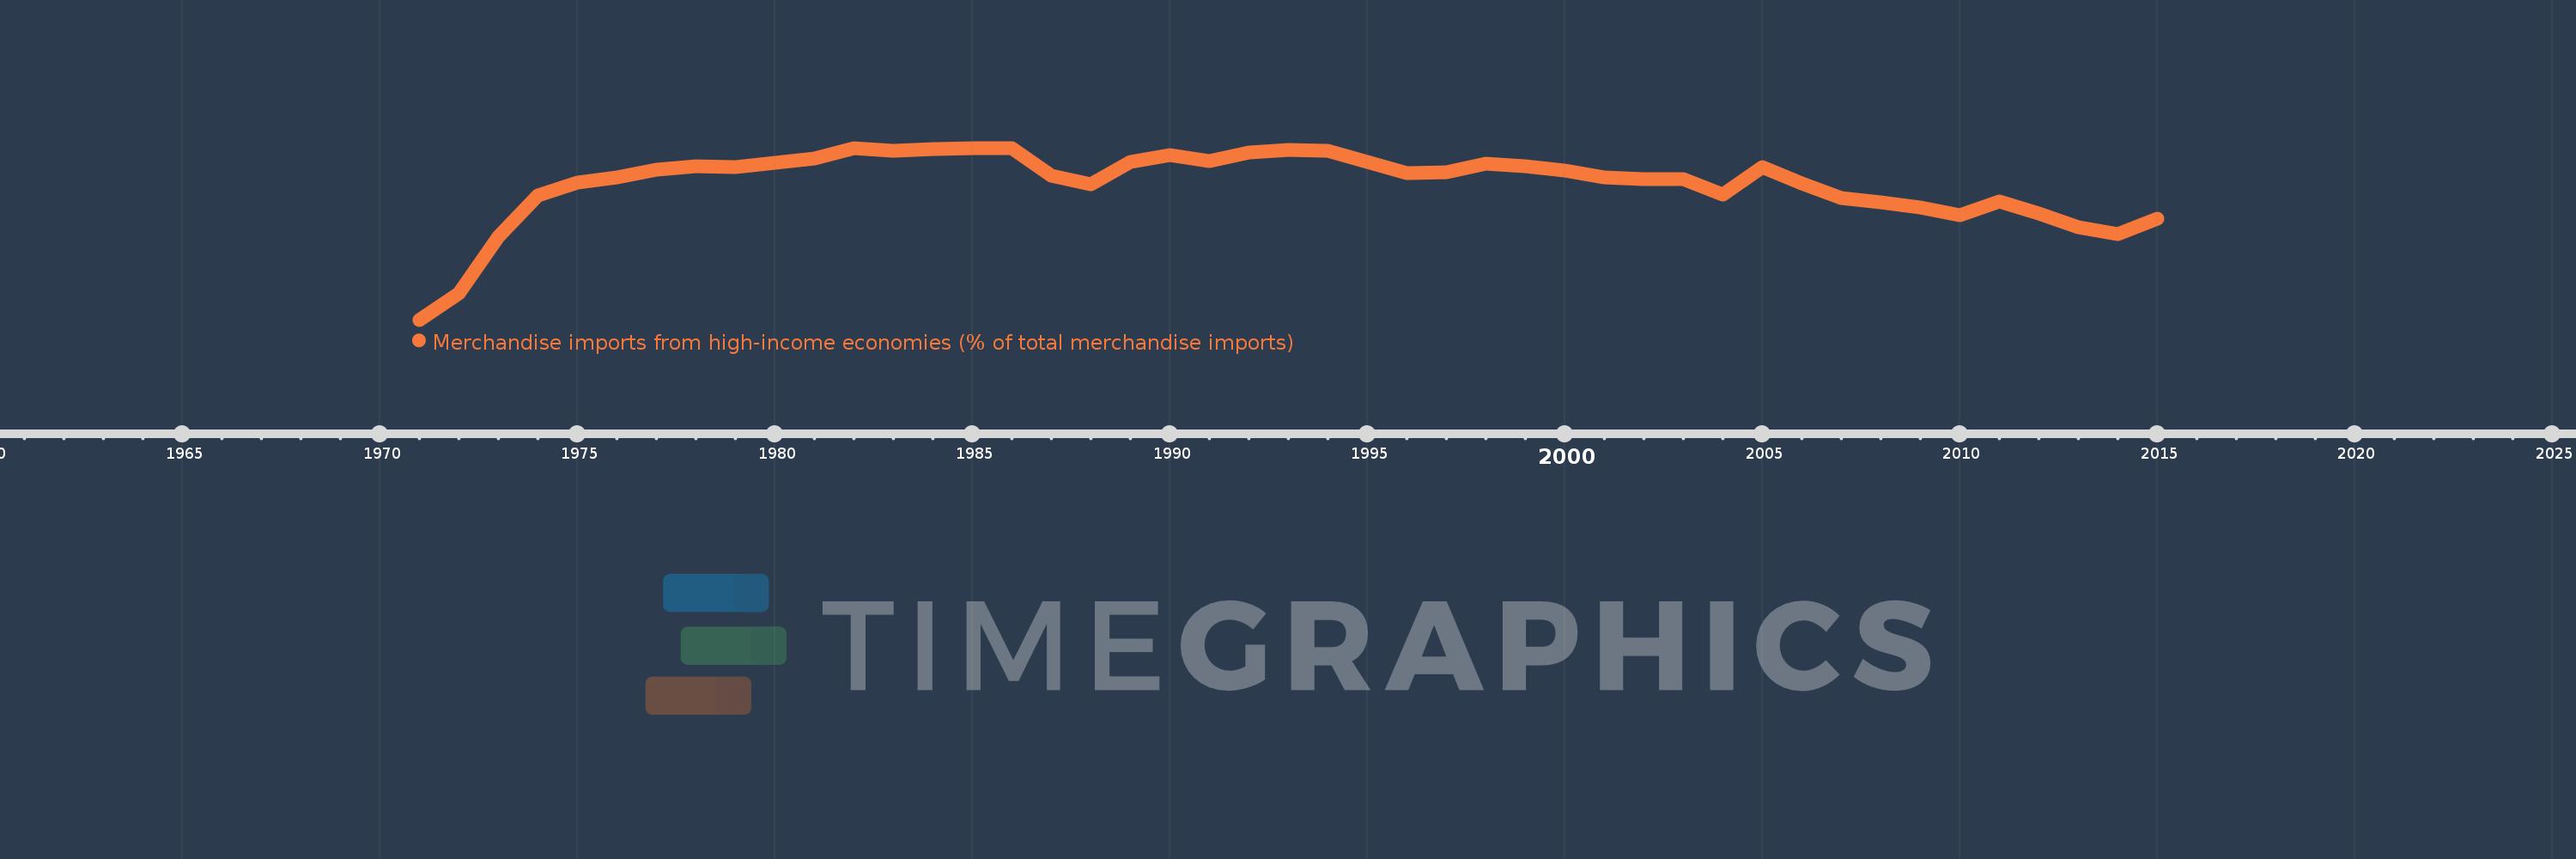
Merchandise imports from high-income economies (% of total merchandise imports)
2015,2014,2013,2012,2011,2010,2009,2008,2007,2006,2005,2004,2003,2002,2001,2000,1999,1998,1997,1996,1995,1994,1993,1992,1991,1990,1989,1988,1987,1986,1985,1984,1983,1982,1981,1980,1979,1978,1977,1976,1975,1974,1973,1972,1971
This statistics in other country:
AfghanistanAlbaniaAlgeriaAngolaAntigua and BarbudaArab WorldArgentinaArmeniaArubaAustraliaAustriaAzerbaijanBahamas, TheBahrainBangladeshBarbadosBelarusBelgiumBelizeBeninBermudaBoliviaBosnia and HerzegovinaBrazilBrunei DarussalamBulgariaBurkina FasoBurundiCabo VerdeCambodiaCameroonCanadaCaribbean small statesCentral African RepublicCentral Europe and the BalticsChadChileChinaColombiaComorosCongo, Dem. Rep.Congo, Rep.Costa RicaCote d'IvoireCroatiaCubaCyprusCzech RepublicDenmarkDjiboutiDominicaDominican RepublicEarly-demographic dividendEast Asia & PacificEast Asia & Pacific (excluding high income)East Asia & Pacific (IDA & IBRD countries)EcuadorEgypt, Arab Rep.El SalvadorEquatorial GuineaEstoniaEthiopiaEuro areaEurope & Central AsiaEurope & Central Asia (excluding high income)Europe & Central Asia (IDA & IBRD countries)European UnionFaroe IslandsFijiFinlandFragile and conflict affected situationsFranceFrench PolynesiaGabonGambia, TheGeorgiaGermanyGhanaGibraltarGreeceGreenlandGrenadaGuamGuatemalaGuineaGuinea-BissauGuyanaHaitiHeavily indebted poor countries (HIPC)High incomeHondurasHong Kong SAR, ChinaHungaryIBRD onlyIcelandIDA & IBRD totalIDA blendIDA onlyIDA totalIndiaIndonesiaIran, Islamic Rep.IraqIrelandIsraelItalyJamaicaJapanJordanKazakhstanKenyaKiribatiKorea, Dem. People’s Rep.Korea, Rep.KosovoKuwaitKyrgyz RepublicLao PDRLate-demographic dividendLatin America & Caribbean Latin America & Caribbean (excluding high income)Latin America & the Caribbean (IDA & IBRD countries)LatviaLeast developed countries: UN classificationLebanonLiberiaLibyaLithuaniaLow & middle incomeLow incomeLower middle incomeLuxembourgMacao SAR, ChinaMacedonia, FYRMadagascarMalawiMalaysiaMaldivesMaliMaltaMauritaniaMauritiusMexicoMiddle East & North AfricaMiddle East & North Africa (excluding high income)Middle East & North Africa (IDA & IBRD countries)Middle incomeMoldovaMongoliaMontenegroMoroccoMozambiqueMyanmarNauruNepalNetherlandsNew CaledoniaNew ZealandNicaraguaNigerNigeriaNorth AmericaNorwayOECD membersOmanOther small statesPacific island small statesPakistanPanamaPapua New GuineaParaguayPeruPhilippinesPolandPortugalPost-demographic dividendPre-demographic dividendQatarRomaniaRussian FederationRwandaSamoaSao Tome and PrincipeSaudi ArabiaSenegalSerbiaSeychellesSierra LeoneSingaporeSlovak RepublicSloveniaSmall statesSolomon IslandsSomaliaSouth AfricaSouth AsiaSouth Asia (IDA & IBRD)SpainSri LankaSt. Kitts and NevisSt. LuciaSt. Vincent and the GrenadinesSub-Saharan Africa Sub-Saharan Africa (excluding high income)Sub-Saharan Africa (IDA & IBRD countries)SudanSurinameSwedenSwitzerlandSyrian Arab RepublicTajikistanTanzaniaThailandTogoTongaTrinidad and TobagoTunisiaTurkeyTurkmenistanTuvaluUgandaUkraineUnited Arab EmiratesUnited KingdomUnited StatesUpper middle incomeUruguayUzbekistanVanuatuVenezuela, RBVietnamWorldYemen, Rep.ZambiaZimbabwe Timeline:
This timeline shows a graph from 1971 to 2015 of Oman. No data until 1970. Number of actual observations by date: 45.
Source name:
World Development Indicators
Source organization:
World Bank staff estimates based data from International Monetary Fund's Direction of Trade database.
Categories, topics:
Private Sector, Trade
Last updated:
apr 23, 2017
Indicators value changes by year
Minimum:
56.391
jan 1, 1971
At the date of observation
Value
Absolute change
Change from previous value
jan 1, 1971
56.391
+56.391
0.0%
jan 1, 1972
61.976
+5.586
9.91%
jan 1, 1973
74.051
+12.075
19.48%
jan 1, 1974
82.703
+8.652
11.68%
jan 1, 1975
85.415
+2.712
3.28%
jan 1, 1976
86.54
+1.125
1.32%
jan 1, 1977
88.147
+1.607
1.86%
jan 1, 1978
88.943
+0.797
0.9%
jan 1, 1979
88.778
-0.165
-0.19%
jan 1, 1980
89.708
+0.93
1.05%
jan 1, 1981
90.567
+0.859
0.96%
jan 1, 1982
92.704
+2.137
2.36%
jan 1, 1983
92.191
-0.513
-0.55%
jan 1, 1984
92.477
+0.286
0.31%
jan 1, 1985
92.677
+0.2
0.22%
jan 1, 1986
92.79
+0.113
0.12%
jan 1, 1987
86.93
-5.861
-6.32%
jan 1, 1988
85.14
-1.79
-2.06%
jan 1, 1989
89.738
+4.599
5.4%
jan 1, 1990
91.365
+1.627
1.81%
jan 1, 1991
90.035
-1.33
-1.46%
jan 1, 1992
91.764
+1.729
1.92%
jan 1, 1993
92.455
+0.691
0.75%
jan 1, 1994
92.192
-0.263
-0.28%
jan 1, 1995
89.868
-2.324
-2.52%
jan 1, 1996
87.502
-2.366
-2.63%
jan 1, 1997
87.6
+0.099
0.11%
jan 1, 1998
89.378
+1.778
2.03%
jan 1, 1999
89.0
-0.378
-0.42%
jan 1, 2000
88.027
-0.973
-1.09%
jan 1, 2001
86.62
-1.407
-1.6%
jan 1, 2002
86.18
-0.441
-0.51%
jan 1, 2003
86.227
+0.048
0.06%
jan 1, 2004
82.846
-3.382
-3.92%
jan 1, 2005
88.739
+5.894
7.11%
jan 1, 2006
85.336
-3.403
-3.83%
jan 1, 2007
82.118
-3.219
-3.77%
jan 1, 2008
81.181
-0.937
-1.14%
jan 1, 2009
80.2
-0.981
-1.21%
jan 1, 2010
78.542
-1.658
-2.07%
jan 1, 2011
81.513
+2.971
3.78%
jan 1, 2012
78.91
-2.603
-3.19%
jan 1, 2013
75.983
-2.927
-3.71%
jan 1, 2014
74.513
-1.471
-1.94%
jan 1, 2015
77.875
+3.362
4.51%
Ranking of countries by current statistics by years


Comments: