29
/
en
AIzaSyAYiBZKx7MnpbEhh9jyipgxe19OcubqV5w
April 1, 2024
58311
South Asia (IDA & IBRD)
TSA
false
2
1
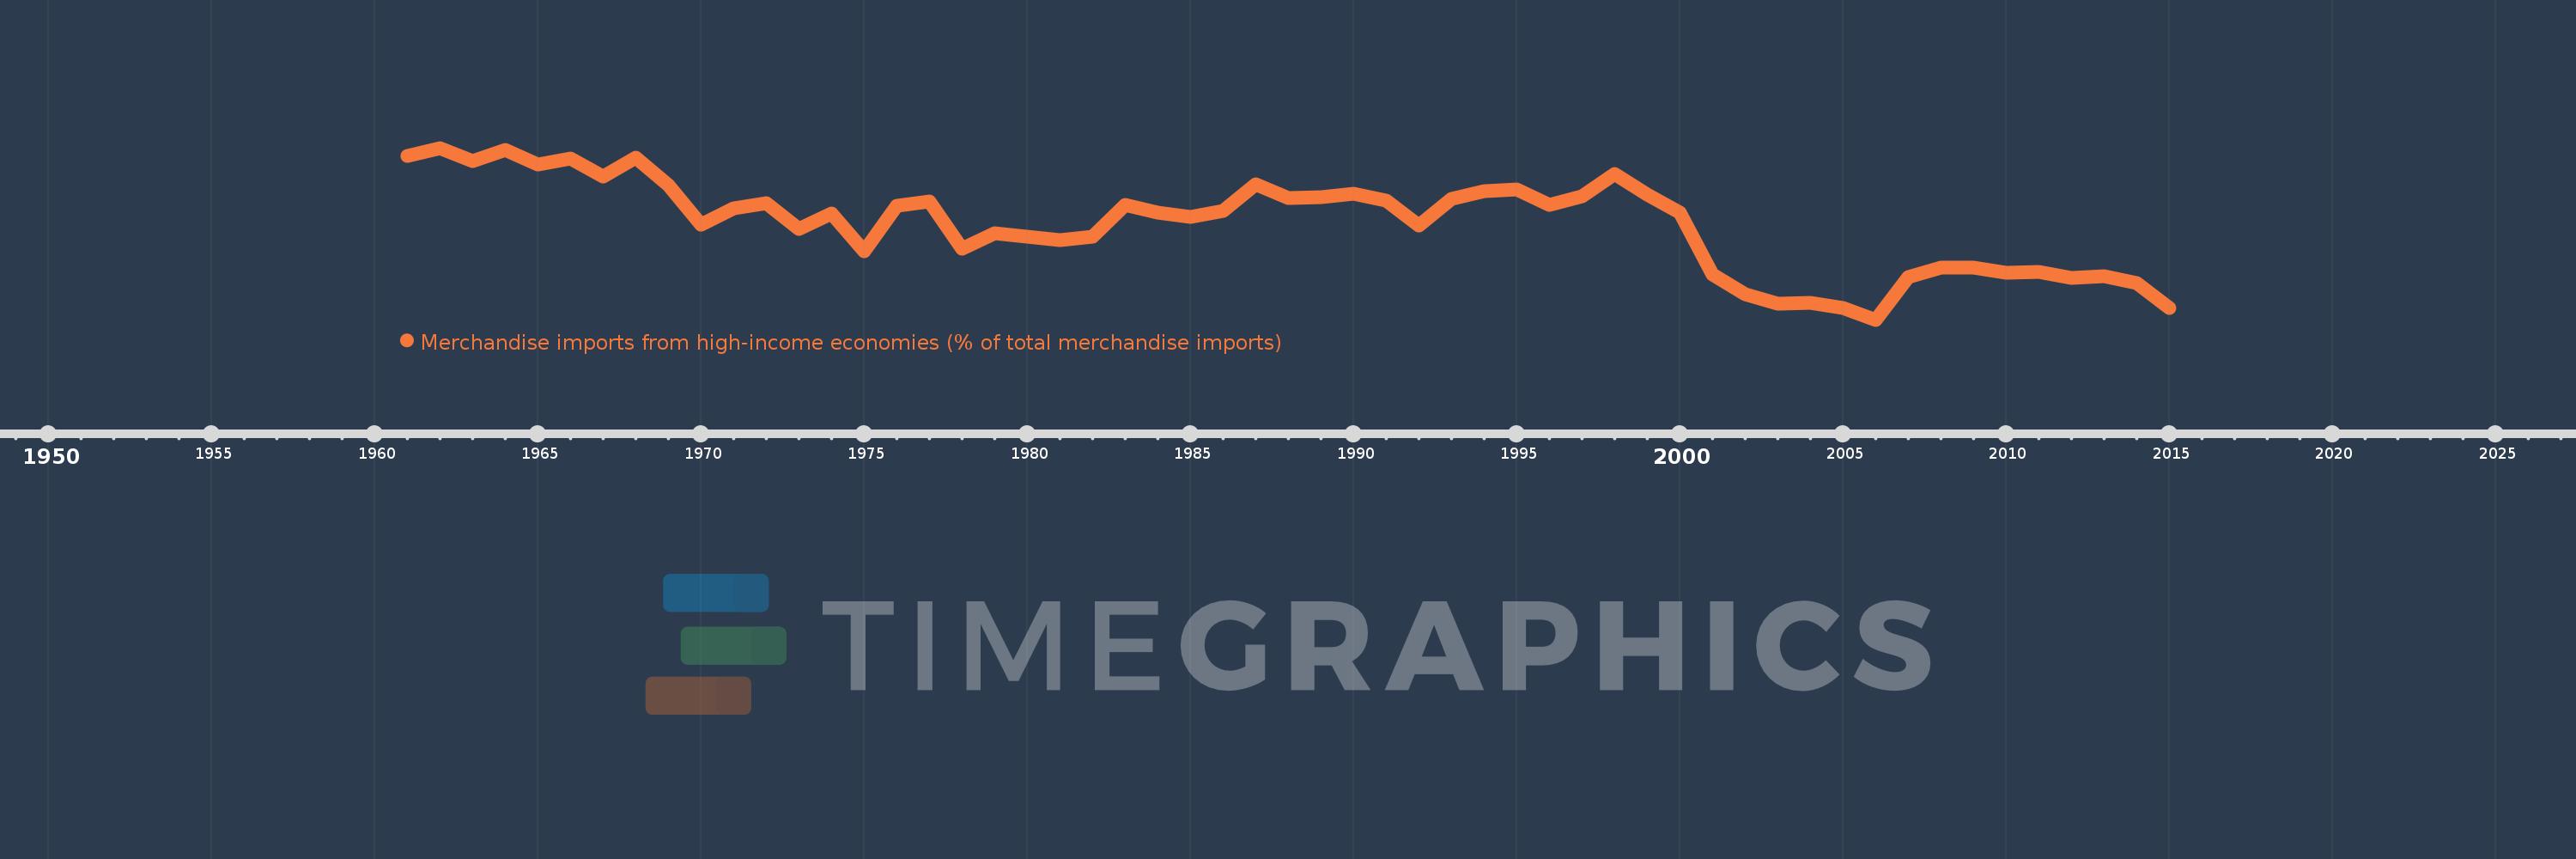
Merchandise imports from high-income economies (% of total merchandise imports)
2015,2014,2013,2012,2011,2010,2009,2008,2007,2006,2005,2004,2003,2002,2001,2000,1999,1998,1997,1996,1995,1994,1993,1992,1991,1990,1989,1988,1987,1986,1985,1984,1983,1982,1981,1980,1979,1978,1977,1976,1975,1974,1973,1972,1971,1970,1969,1968,1967,1966,1965,1964,1963,1962,1961
This statistics in other country:
AfghanistanAlbaniaAlgeriaAngolaAntigua and BarbudaArab WorldArgentinaArmeniaArubaAustraliaAustriaAzerbaijanBahamas, TheBahrainBangladeshBarbadosBelarusBelgiumBelizeBeninBermudaBoliviaBosnia and HerzegovinaBrazilBrunei DarussalamBulgariaBurkina FasoBurundiCabo VerdeCambodiaCameroonCanadaCaribbean small statesCentral African RepublicCentral Europe and the BalticsChadChileChinaColombiaComorosCongo, Dem. Rep.Congo, Rep.Costa RicaCote d'IvoireCroatiaCubaCyprusCzech RepublicDenmarkDjiboutiDominicaDominican RepublicEarly-demographic dividendEast Asia & PacificEast Asia & Pacific (excluding high income)East Asia & Pacific (IDA & IBRD countries)EcuadorEgypt, Arab Rep.El SalvadorEquatorial GuineaEstoniaEthiopiaEuro areaEurope & Central AsiaEurope & Central Asia (excluding high income)Europe & Central Asia (IDA & IBRD countries)European UnionFaroe IslandsFijiFinlandFragile and conflict affected situationsFranceFrench PolynesiaGabonGambia, TheGeorgiaGermanyGhanaGibraltarGreeceGreenlandGrenadaGuamGuatemalaGuineaGuinea-BissauGuyanaHaitiHeavily indebted poor countries (HIPC)High incomeHondurasHong Kong SAR, ChinaHungaryIBRD onlyIcelandIDA & IBRD totalIDA blendIDA onlyIDA totalIndiaIndonesiaIran, Islamic Rep.IraqIrelandIsraelItalyJamaicaJapanJordanKazakhstanKenyaKiribatiKorea, Dem. People’s Rep.Korea, Rep.KosovoKuwaitKyrgyz RepublicLao PDRLate-demographic dividendLatin America & Caribbean Latin America & Caribbean (excluding high income)Latin America & the Caribbean (IDA & IBRD countries)LatviaLeast developed countries: UN classificationLebanonLiberiaLibyaLithuaniaLow & middle incomeLow incomeLower middle incomeLuxembourgMacao SAR, ChinaMacedonia, FYRMadagascarMalawiMalaysiaMaldivesMaliMaltaMauritaniaMauritiusMexicoMiddle East & North AfricaMiddle East & North Africa (excluding high income)Middle East & North Africa (IDA & IBRD countries)Middle incomeMoldovaMongoliaMontenegroMoroccoMozambiqueMyanmarNauruNepalNetherlandsNew CaledoniaNew ZealandNicaraguaNigerNigeriaNorth AmericaNorwayOECD membersOmanOther small statesPacific island small statesPakistanPanamaPapua New GuineaParaguayPeruPhilippinesPolandPortugalPost-demographic dividendPre-demographic dividendQatarRomaniaRussian FederationRwandaSamoaSao Tome and PrincipeSaudi ArabiaSenegalSerbiaSeychellesSierra LeoneSingaporeSlovak RepublicSloveniaSmall statesSolomon IslandsSomaliaSouth AfricaSouth AsiaSouth Asia (IDA & IBRD)SpainSri LankaSt. Kitts and NevisSt. LuciaSt. Vincent and the GrenadinesSub-Saharan Africa Sub-Saharan Africa (excluding high income)Sub-Saharan Africa (IDA & IBRD countries)SudanSurinameSwedenSwitzerlandSyrian Arab RepublicTajikistanTanzaniaThailandTogoTongaTrinidad and TobagoTunisiaTurkeyTurkmenistanTuvaluUgandaUkraineUnited Arab EmiratesUnited KingdomUnited StatesUpper middle incomeUruguayUzbekistanVanuatuVenezuela, RBVietnamWorldYemen, Rep.ZambiaZimbabwe Timeline:
This timeline shows a graph from 1961 to 2015 of South Asia (IDA & IBRD). No data until 1960. Number of actual observations by date: 55.
Source name:
World Development Indicators
Source organization:
World Bank staff estimates based data from International Monetary Fund's Direction of Trade database.
Categories, topics:
Private Sector, Trade
Last updated:
apr 23, 2017
Indicators value changes by year
Minimum:
53.067
jan 1, 2006
Maximum:
78.578
jan 1, 1962
At the date of observation
Value
Absolute change
Change from previous value
jan 1, 1961
77.395
+77.395
0.0%
jan 1, 1962
78.578
+1.183
1.53%
jan 1, 1963
76.675
-1.903
-2.42%
jan 1, 1964
78.318
+1.643
2.14%
jan 1, 1965
76.084
-2.234
-2.85%
jan 1, 1966
76.998
+0.914
1.2%
jan 1, 1967
74.268
-2.73
-3.55%
jan 1, 1968
77.134
+2.866
3.86%
jan 1, 1969
73.103
-4.031
-5.23%
jan 1, 1970
67.126
-5.978
-8.18%
jan 1, 1971
69.581
+2.456
3.66%
jan 1, 1972
70.416
+0.835
1.2%
jan 1, 1973
66.525
-3.891
-5.53%
jan 1, 1974
68.856
+2.331
3.5%
jan 1, 1975
63.232
-5.624
-8.17%
jan 1, 1976
70.039
+6.807
10.77%
jan 1, 1977
70.687
+0.647
0.92%
jan 1, 1978
63.585
-7.102
-10.05%
jan 1, 1979
65.927
+2.342
3.68%
jan 1, 1980
65.362
-0.565
-0.86%
jan 1, 1981
64.893
-0.469
-0.72%
jan 1, 1982
65.352
+0.459
0.71%
jan 1, 1983
70.144
+4.792
7.33%
jan 1, 1984
68.991
-1.153
-1.64%
jan 1, 1985
68.353
-0.638
-0.92%
jan 1, 1986
69.25
+0.897
1.31%
jan 1, 1987
73.182
+3.932
5.68%
jan 1, 1988
71.127
-2.055
-2.81%
jan 1, 1989
71.29
+0.163
0.23%
jan 1, 1990
71.802
+0.512
0.72%
jan 1, 1991
70.755
-1.047
-1.46%
jan 1, 1992
67.054
-3.701
-5.23%
jan 1, 1993
71.026
+3.972
5.92%
jan 1, 1994
72.209
+1.183
1.67%
jan 1, 1995
72.401
+0.191
0.27%
jan 1, 1996
70.166
-2.235
-3.09%
jan 1, 1997
71.341
+1.176
1.68%
jan 1, 1998
74.689
+3.348
4.69%
jan 1, 1999
71.607
-3.083
-4.13%
jan 1, 2000
69.003
-2.604
-3.64%
jan 1, 2001
59.843
-9.16
-13.27%
jan 1, 2002
56.891
-2.952
-4.93%
jan 1, 2003
55.514
-1.377
-2.42%
jan 1, 2004
55.57
+0.057
0.1%
jan 1, 2005
54.833
-0.737
-1.33%
jan 1, 2006
53.067
-1.766
-3.22%
jan 1, 2007
59.44
+6.374
12.01%
jan 1, 2008
60.806
+1.365
2.3%
jan 1, 2009
60.81
+0.005
0.01%
jan 1, 2010
60.084
-0.726
-1.19%
jan 1, 2011
60.127
+0.043
0.07%
jan 1, 2012
59.259
-0.869
-1.44%
jan 1, 2013
59.561
+0.302
0.51%
jan 1, 2014
58.473
-1.088
-1.83%
jan 1, 2015
54.868
-3.605
-6.17%
Ranking of countries by current statistics by years


Comments: