29
/
en
AIzaSyAYiBZKx7MnpbEhh9jyipgxe19OcubqV5w
April 1, 2024
286174
Zambia
ZMB
true
2
1
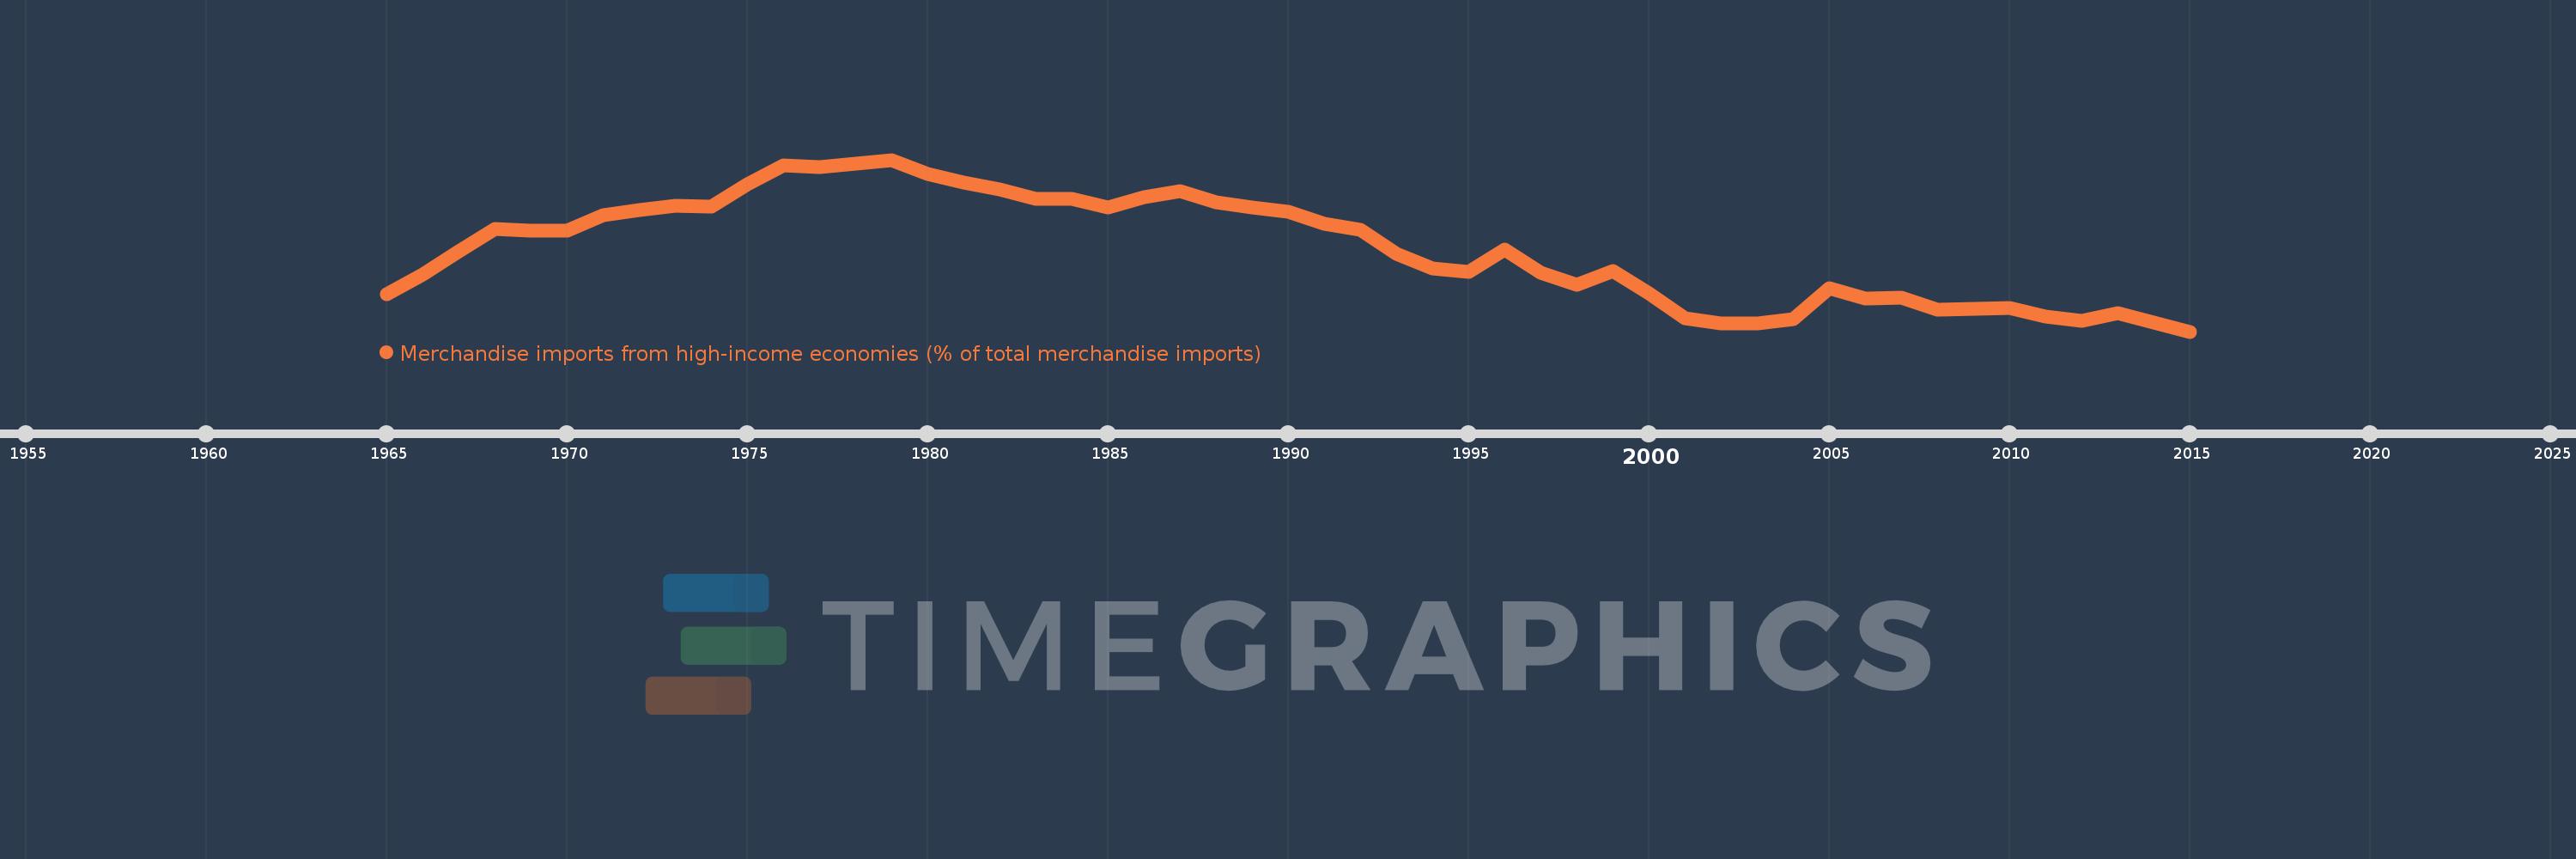
Merchandise imports from high-income economies (% of total merchandise imports)
2015,2014,2013,2012,2011,2010,2009,2008,2007,2006,2005,2004,2003,2002,2001,2000,1999,1998,1997,1996,1995,1994,1993,1992,1991,1990,1989,1988,1987,1986,1985,1984,1983,1982,1981,1980,1979,1978,1977,1976,1975,1974,1973,1972,1971,1970,1969,1968,1967,1966,1965
This statistics in other country:
AfghanistanAlbaniaAlgeriaAngolaAntigua and BarbudaArab WorldArgentinaArmeniaArubaAustraliaAustriaAzerbaijanBahamas, TheBahrainBangladeshBarbadosBelarusBelgiumBelizeBeninBermudaBoliviaBosnia and HerzegovinaBrazilBrunei DarussalamBulgariaBurkina FasoBurundiCabo VerdeCambodiaCameroonCanadaCaribbean small statesCentral African RepublicCentral Europe and the BalticsChadChileChinaColombiaComorosCongo, Dem. Rep.Congo, Rep.Costa RicaCote d'IvoireCroatiaCubaCyprusCzech RepublicDenmarkDjiboutiDominicaDominican RepublicEarly-demographic dividendEast Asia & PacificEast Asia & Pacific (excluding high income)East Asia & Pacific (IDA & IBRD countries)EcuadorEgypt, Arab Rep.El SalvadorEquatorial GuineaEstoniaEthiopiaEuro areaEurope & Central AsiaEurope & Central Asia (excluding high income)Europe & Central Asia (IDA & IBRD countries)European UnionFaroe IslandsFijiFinlandFragile and conflict affected situationsFranceFrench PolynesiaGabonGambia, TheGeorgiaGermanyGhanaGibraltarGreeceGreenlandGrenadaGuamGuatemalaGuineaGuinea-BissauGuyanaHaitiHeavily indebted poor countries (HIPC)High incomeHondurasHong Kong SAR, ChinaHungaryIBRD onlyIcelandIDA & IBRD totalIDA blendIDA onlyIDA totalIndiaIndonesiaIran, Islamic Rep.IraqIrelandIsraelItalyJamaicaJapanJordanKazakhstanKenyaKiribatiKorea, Dem. People’s Rep.Korea, Rep.KosovoKuwaitKyrgyz RepublicLao PDRLate-demographic dividendLatin America & Caribbean Latin America & Caribbean (excluding high income)Latin America & the Caribbean (IDA & IBRD countries)LatviaLeast developed countries: UN classificationLebanonLiberiaLibyaLithuaniaLow & middle incomeLow incomeLower middle incomeLuxembourgMacao SAR, ChinaMacedonia, FYRMadagascarMalawiMalaysiaMaldivesMaliMaltaMauritaniaMauritiusMexicoMiddle East & North AfricaMiddle East & North Africa (excluding high income)Middle East & North Africa (IDA & IBRD countries)Middle incomeMoldovaMongoliaMontenegroMoroccoMozambiqueMyanmarNauruNepalNetherlandsNew CaledoniaNew ZealandNicaraguaNigerNigeriaNorth AmericaNorwayOECD membersOmanOther small statesPacific island small statesPakistanPanamaPapua New GuineaParaguayPeruPhilippinesPolandPortugalPost-demographic dividendPre-demographic dividendQatarRomaniaRussian FederationRwandaSamoaSao Tome and PrincipeSaudi ArabiaSenegalSerbiaSeychellesSierra LeoneSingaporeSlovak RepublicSloveniaSmall statesSolomon IslandsSomaliaSouth AfricaSouth AsiaSouth Asia (IDA & IBRD)SpainSri LankaSt. Kitts and NevisSt. LuciaSt. Vincent and the GrenadinesSub-Saharan Africa Sub-Saharan Africa (excluding high income)Sub-Saharan Africa (IDA & IBRD countries)SudanSurinameSwedenSwitzerlandSyrian Arab RepublicTajikistanTanzaniaThailandTogoTongaTrinidad and TobagoTunisiaTurkeyTurkmenistanTuvaluUgandaUkraineUnited Arab EmiratesUnited KingdomUnited StatesUpper middle incomeUruguayUzbekistanVanuatuVenezuela, RBVietnamWorldYemen, Rep.ZambiaZimbabwe Timeline:
This timeline shows a graph from 1965 to 2015 of Zambia. No data until 1964. Number of actual observations by date: 51.
Source name:
World Development Indicators
Source organization:
World Bank staff estimates based data from International Monetary Fund's Direction of Trade database.
Categories, topics:
Private Sector, Trade
Last updated:
apr 23, 2017
Indicators value changes by year
Minimum:
21.724
jan 1, 2015
Maximum:
83.378
jan 1, 1979
At the date of observation
Value
Absolute change
Change from previous value
jan 1, 1965
35.056
+35.056
0.0%
jan 1, 1966
42.166
+7.11
20.28%
jan 1, 1967
50.598
+8.432
20.0%
jan 1, 1968
58.571
+7.973
15.76%
jan 1, 1969
57.941
-0.63
-1.08%
jan 1, 1970
57.874
-0.067
-0.12%
jan 1, 1971
63.352
+5.478
9.47%
jan 1, 1972
65.228
+1.876
2.96%
jan 1, 1973
66.838
+1.61
2.47%
jan 1, 1974
66.642
-0.197
-0.29%
jan 1, 1975
74.487
+7.845
11.77%
jan 1, 1976
81.367
+6.88
9.24%
jan 1, 1977
80.787
-0.581
-0.71%
jan 1, 1978
82.091
+1.305
1.62%
jan 1, 1979
83.378
+1.287
1.57%
jan 1, 1980
78.442
-4.936
-5.92%
jan 1, 1981
75.13
-3.312
-4.22%
jan 1, 1982
72.722
-2.408
-3.21%
jan 1, 1983
69.225
-3.496
-4.81%
jan 1, 1984
69.225
+0.0
0.0%
jan 1, 1985
66.173
-3.052
-4.41%
jan 1, 1986
69.956
+3.783
5.72%
jan 1, 1987
72.07
+2.114
3.02%
jan 1, 1988
68.016
-4.054
-5.63%
jan 1, 1989
66.152
-1.864
-2.74%
jan 1, 1990
64.683
-1.469
-2.22%
jan 1, 1991
60.471
-4.212
-6.51%
jan 1, 1992
58.307
-2.164
-3.58%
jan 1, 1993
49.605
-8.702
-14.92%
jan 1, 1994
44.496
-5.109
-10.3%
jan 1, 1995
43.236
-1.26
-2.83%
jan 1, 1996
51.205
+7.969
18.43%
jan 1, 1997
42.98
-8.225
-16.06%
jan 1, 1998
38.669
-4.312
-10.03%
jan 1, 1999
43.46
+4.792
12.39%
jan 1, 2000
35.561
-7.899
-18.18%
jan 1, 2001
26.461
-9.1
-25.59%
jan 1, 2002
24.671
-1.79
-6.76%
jan 1, 2003
24.74
+0.068
0.28%
jan 1, 2004
26.202
+1.462
5.91%
jan 1, 2005
37.228
+11.026
42.08%
jan 1, 2006
33.632
-3.596
-9.66%
jan 1, 2007
33.762
+0.13
0.39%
jan 1, 2008
29.481
-4.281
-12.68%
jan 1, 2009
29.842
+0.361
1.22%
jan 1, 2010
30.113
+0.271
0.91%
jan 1, 2011
27.236
-2.877
-9.55%
jan 1, 2012
25.562
-1.674
-6.15%
jan 1, 2013
28.236
+2.675
10.46%
jan 1, 2014
24.976
-3.261
-11.55%
jan 1, 2015
21.724
-3.252
-13.02%
Ranking of countries by current statistics by years


Comments: