29
/
en
AIzaSyAYiBZKx7MnpbEhh9jyipgxe19OcubqV5w
April 1, 2024
167781
Kenya
KEN
true
2
1
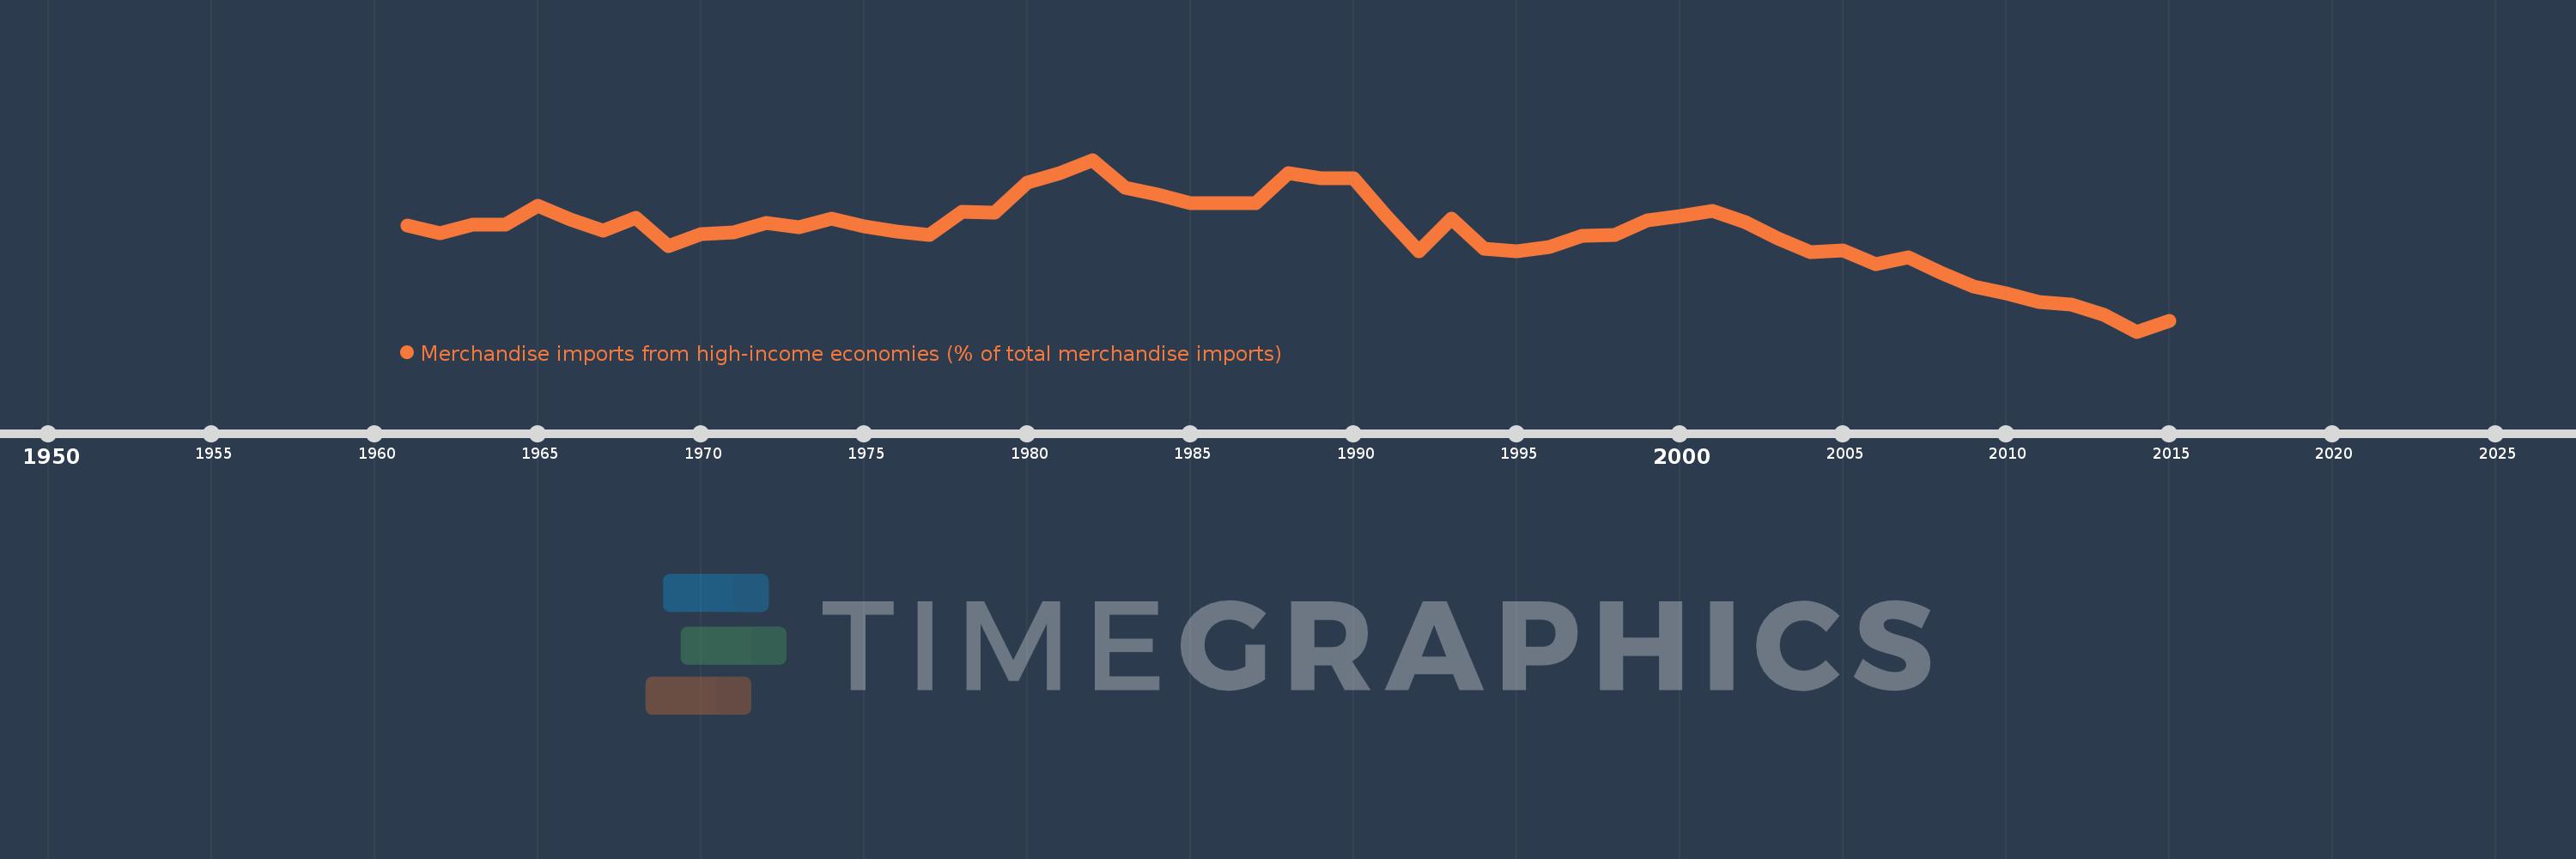
Merchandise imports from high-income economies (% of total merchandise imports)
2015,2014,2013,2012,2011,2010,2009,2008,2007,2006,2005,2004,2003,2002,2001,2000,1999,1998,1997,1996,1995,1994,1993,1992,1991,1990,1989,1988,1987,1986,1985,1984,1983,1982,1981,1980,1979,1978,1977,1976,1975,1974,1973,1972,1971,1970,1969,1968,1967,1966,1965,1964,1963,1962,1961
This statistics in other country:
AfghanistanAlbaniaAlgeriaAngolaAntigua and BarbudaArab WorldArgentinaArmeniaArubaAustraliaAustriaAzerbaijanBahamas, TheBahrainBangladeshBarbadosBelarusBelgiumBelizeBeninBermudaBoliviaBosnia and HerzegovinaBrazilBrunei DarussalamBulgariaBurkina FasoBurundiCabo VerdeCambodiaCameroonCanadaCaribbean small statesCentral African RepublicCentral Europe and the BalticsChadChileChinaColombiaComorosCongo, Dem. Rep.Congo, Rep.Costa RicaCote d'IvoireCroatiaCubaCyprusCzech RepublicDenmarkDjiboutiDominicaDominican RepublicEarly-demographic dividendEast Asia & PacificEast Asia & Pacific (excluding high income)East Asia & Pacific (IDA & IBRD countries)EcuadorEgypt, Arab Rep.El SalvadorEquatorial GuineaEstoniaEthiopiaEuro areaEurope & Central AsiaEurope & Central Asia (excluding high income)Europe & Central Asia (IDA & IBRD countries)European UnionFaroe IslandsFijiFinlandFragile and conflict affected situationsFranceFrench PolynesiaGabonGambia, TheGeorgiaGermanyGhanaGibraltarGreeceGreenlandGrenadaGuamGuatemalaGuineaGuinea-BissauGuyanaHaitiHeavily indebted poor countries (HIPC)High incomeHondurasHong Kong SAR, ChinaHungaryIBRD onlyIcelandIDA & IBRD totalIDA blendIDA onlyIDA totalIndiaIndonesiaIran, Islamic Rep.IraqIrelandIsraelItalyJamaicaJapanJordanKazakhstanKenyaKiribatiKorea, Dem. People’s Rep.Korea, Rep.KosovoKuwaitKyrgyz RepublicLao PDRLate-demographic dividendLatin America & Caribbean Latin America & Caribbean (excluding high income)Latin America & the Caribbean (IDA & IBRD countries)LatviaLeast developed countries: UN classificationLebanonLiberiaLibyaLithuaniaLow & middle incomeLow incomeLower middle incomeLuxembourgMacao SAR, ChinaMacedonia, FYRMadagascarMalawiMalaysiaMaldivesMaliMaltaMauritaniaMauritiusMexicoMiddle East & North AfricaMiddle East & North Africa (excluding high income)Middle East & North Africa (IDA & IBRD countries)Middle incomeMoldovaMongoliaMontenegroMoroccoMozambiqueMyanmarNauruNepalNetherlandsNew CaledoniaNew ZealandNicaraguaNigerNigeriaNorth AmericaNorwayOECD membersOmanOther small statesPacific island small statesPakistanPanamaPapua New GuineaParaguayPeruPhilippinesPolandPortugalPost-demographic dividendPre-demographic dividendQatarRomaniaRussian FederationRwandaSamoaSao Tome and PrincipeSaudi ArabiaSenegalSerbiaSeychellesSierra LeoneSingaporeSlovak RepublicSloveniaSmall statesSolomon IslandsSomaliaSouth AfricaSouth AsiaSouth Asia (IDA & IBRD)SpainSri LankaSt. Kitts and NevisSt. LuciaSt. Vincent and the GrenadinesSub-Saharan Africa Sub-Saharan Africa (excluding high income)Sub-Saharan Africa (IDA & IBRD countries)SudanSurinameSwedenSwitzerlandSyrian Arab RepublicTajikistanTanzaniaThailandTogoTongaTrinidad and TobagoTunisiaTurkeyTurkmenistanTuvaluUgandaUkraineUnited Arab EmiratesUnited KingdomUnited StatesUpper middle incomeUruguayUzbekistanVanuatuVenezuela, RBVietnamWorldYemen, Rep.ZambiaZimbabwe Timeline:
This timeline shows a graph from 1961 to 2015 of Kenya. No data until 1960. Number of actual observations by date: 55.
Source name:
World Development Indicators
Source organization:
World Bank staff estimates based data from International Monetary Fund's Direction of Trade database.
Categories, topics:
Private Sector, Trade
Last updated:
apr 23, 2017
Indicators value changes by year
Minimum:
47.994
jan 1, 2014
Maximum:
90.813
jan 1, 1982
At the date of observation
Value
Absolute change
Change from previous value
jan 1, 1961
74.359
+74.359
0.0%
jan 1, 1962
72.462
-1.897
-2.55%
jan 1, 1963
74.555
+2.093
2.89%
jan 1, 1964
74.73
+0.175
0.23%
jan 1, 1965
79.341
+4.611
6.17%
jan 1, 1966
75.922
-3.419
-4.31%
jan 1, 1967
73.126
-2.796
-3.68%
jan 1, 1968
76.347
+3.221
4.4%
jan 1, 1969
69.364
-6.982
-9.15%
jan 1, 1970
72.357
+2.993
4.31%
jan 1, 1971
72.762
+0.405
0.56%
jan 1, 1972
75.052
+2.29
3.15%
jan 1, 1973
74.017
-1.035
-1.38%
jan 1, 1974
76.216
+2.199
2.97%
jan 1, 1975
74.239
-1.977
-2.59%
jan 1, 1976
72.961
-1.278
-1.72%
jan 1, 1977
72.023
-0.938
-1.29%
jan 1, 1978
77.772
+5.749
7.98%
jan 1, 1979
77.589
-0.183
-0.24%
jan 1, 1980
85.139
+7.55
9.73%
jan 1, 1981
87.409
+2.27
2.67%
jan 1, 1982
90.813
+3.405
3.9%
jan 1, 1983
83.957
-6.857
-7.55%
jan 1, 1984
82.111
-1.845
-2.2%
jan 1, 1985
79.981
-2.13
-2.59%
jan 1, 1986
79.981
+0.0
0.0%
jan 1, 1987
79.981
0.0
0.0%
jan 1, 1988
87.427
+7.446
9.31%
jan 1, 1989
86.216
-1.211
-1.39%
jan 1, 1990
86.216
+0.0
0.0%
jan 1, 1991
76.805
-9.411
-10.92%
jan 1, 1992
67.963
-8.842
-11.51%
jan 1, 1993
76.101
+8.139
11.98%
jan 1, 1994
68.677
-7.424
-9.76%
jan 1, 1995
68.107
-0.57
-0.83%
jan 1, 1996
69.158
+1.052
1.54%
jan 1, 1997
71.9
+2.742
3.96%
jan 1, 1998
72.006
+0.106
0.15%
jan 1, 1999
75.645
+3.639
5.05%
jan 1, 2000
76.698
+1.053
1.39%
jan 1, 2001
77.977
+1.279
1.67%
jan 1, 2002
75.33
-2.646
-3.39%
jan 1, 2003
71.142
-4.188
-5.56%
jan 1, 2004
67.853
-3.289
-4.62%
jan 1, 2005
68.244
+0.391
0.58%
jan 1, 2006
64.836
-3.408
-4.99%
jan 1, 2007
66.588
+1.751
2.7%
jan 1, 2008
62.594
-3.994
-6.0%
jan 1, 2009
59.152
-3.442
-5.5%
jan 1, 2010
57.595
-1.558
-2.63%
jan 1, 2011
55.41
-2.185
-3.79%
jan 1, 2012
54.757
-0.653
-1.18%
jan 1, 2013
52.245
-2.512
-4.59%
jan 1, 2014
47.994
-4.251
-8.14%
jan 1, 2015
50.602
+2.608
5.43%
Ranking of countries by current statistics by years


Comments: