29
/
en
AIzaSyAYiBZKx7MnpbEhh9jyipgxe19OcubqV5w
April 1, 2024
60960
Sub-Saharan Africa (IDA & IBRD countries)
TSS
false
2
1
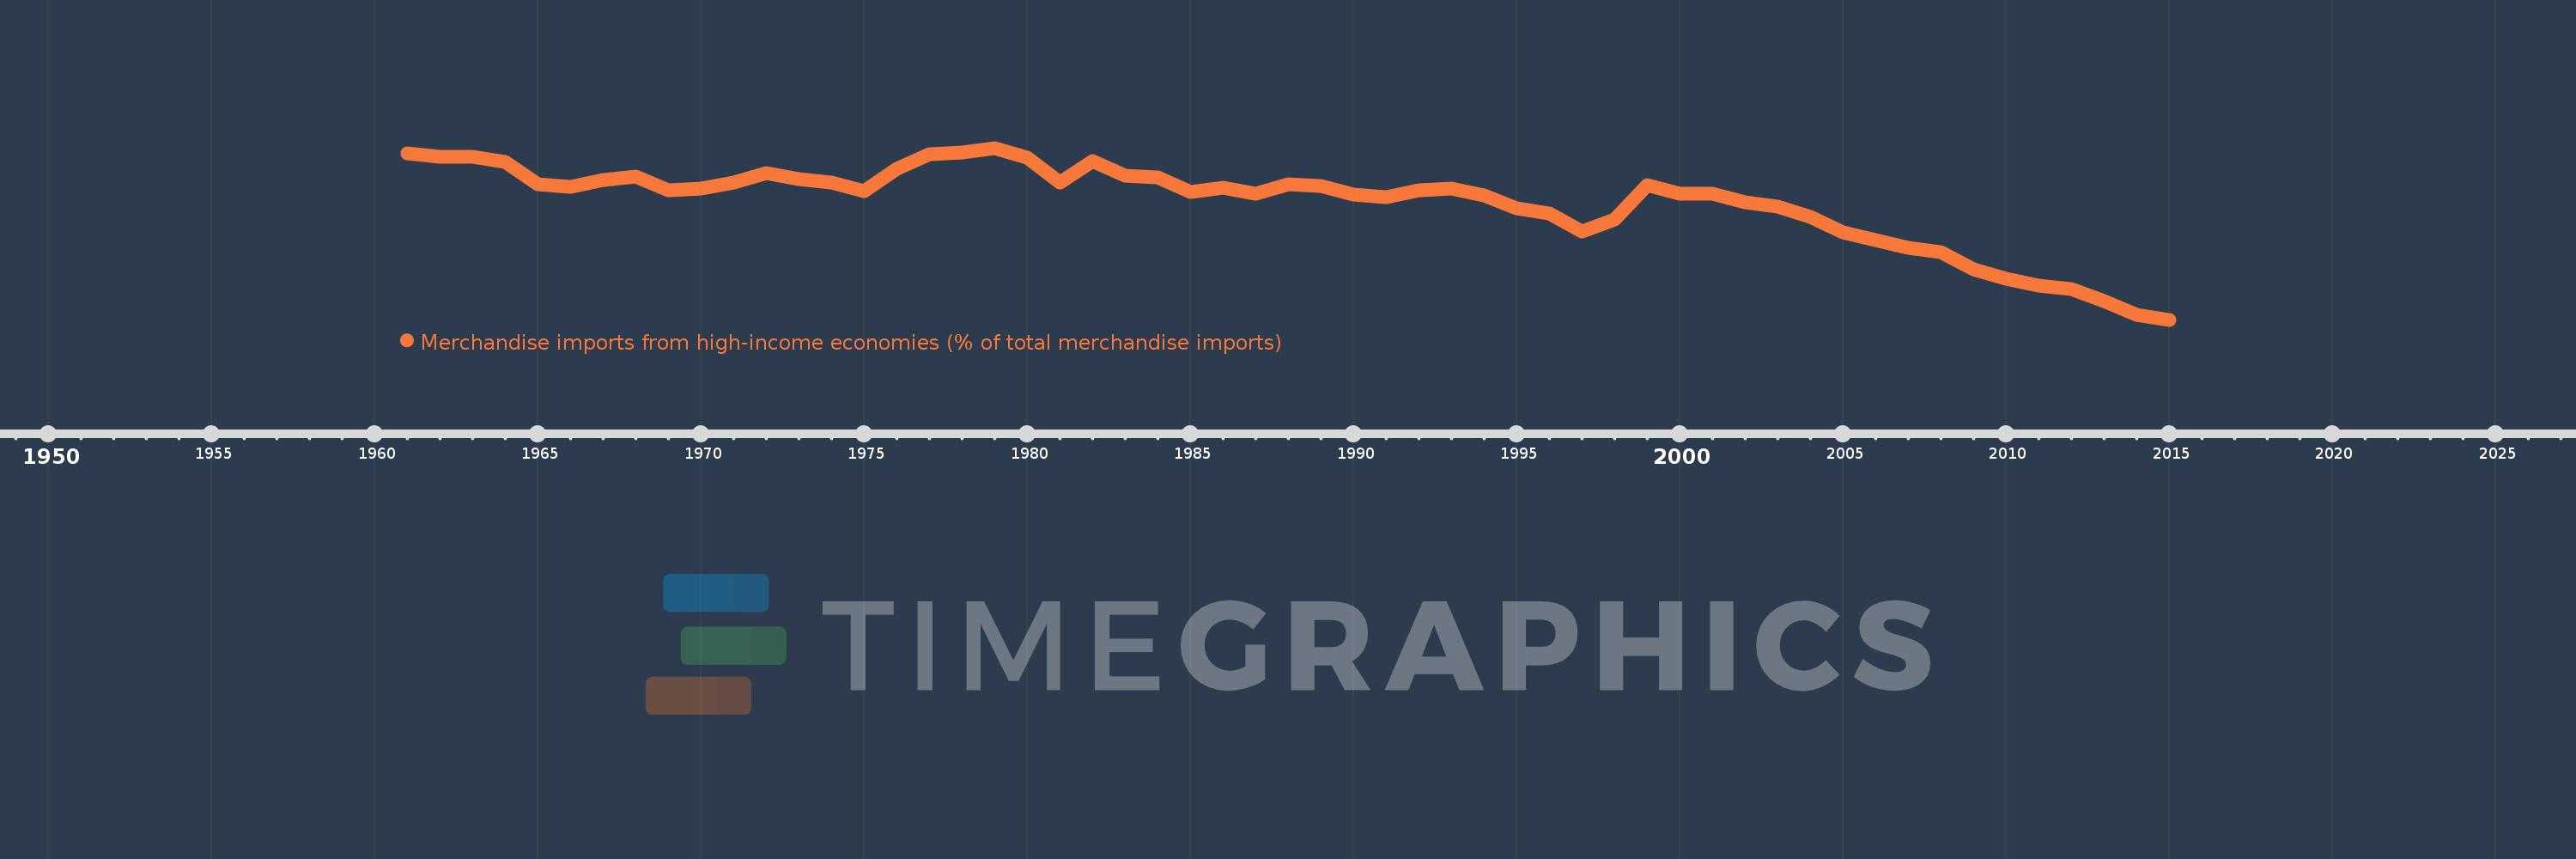
Merchandise imports from high-income economies (% of total merchandise imports)
2015,2014,2013,2012,2011,2010,2009,2008,2007,2006,2005,2004,2003,2002,2001,2000,1999,1998,1997,1996,1995,1994,1993,1992,1991,1990,1989,1988,1987,1986,1985,1984,1983,1982,1981,1980,1979,1978,1977,1976,1975,1974,1973,1972,1971,1970,1969,1968,1967,1966,1965,1964,1963,1962,1961
This statistics in other country:
AfghanistanAlbaniaAlgeriaAngolaAntigua and BarbudaArab WorldArgentinaArmeniaArubaAustraliaAustriaAzerbaijanBahamas, TheBahrainBangladeshBarbadosBelarusBelgiumBelizeBeninBermudaBoliviaBosnia and HerzegovinaBrazilBrunei DarussalamBulgariaBurkina FasoBurundiCabo VerdeCambodiaCameroonCanadaCaribbean small statesCentral African RepublicCentral Europe and the BalticsChadChileChinaColombiaComorosCongo, Dem. Rep.Congo, Rep.Costa RicaCote d'IvoireCroatiaCubaCyprusCzech RepublicDenmarkDjiboutiDominicaDominican RepublicEarly-demographic dividendEast Asia & PacificEast Asia & Pacific (excluding high income)East Asia & Pacific (IDA & IBRD countries)EcuadorEgypt, Arab Rep.El SalvadorEquatorial GuineaEstoniaEthiopiaEuro areaEurope & Central AsiaEurope & Central Asia (excluding high income)Europe & Central Asia (IDA & IBRD countries)European UnionFaroe IslandsFijiFinlandFragile and conflict affected situationsFranceFrench PolynesiaGabonGambia, TheGeorgiaGermanyGhanaGibraltarGreeceGreenlandGrenadaGuamGuatemalaGuineaGuinea-BissauGuyanaHaitiHeavily indebted poor countries (HIPC)High incomeHondurasHong Kong SAR, ChinaHungaryIBRD onlyIcelandIDA & IBRD totalIDA blendIDA onlyIDA totalIndiaIndonesiaIran, Islamic Rep.IraqIrelandIsraelItalyJamaicaJapanJordanKazakhstanKenyaKiribatiKorea, Dem. People’s Rep.Korea, Rep.KosovoKuwaitKyrgyz RepublicLao PDRLate-demographic dividendLatin America & Caribbean Latin America & Caribbean (excluding high income)Latin America & the Caribbean (IDA & IBRD countries)LatviaLeast developed countries: UN classificationLebanonLiberiaLibyaLithuaniaLow & middle incomeLow incomeLower middle incomeLuxembourgMacao SAR, ChinaMacedonia, FYRMadagascarMalawiMalaysiaMaldivesMaliMaltaMauritaniaMauritiusMexicoMiddle East & North AfricaMiddle East & North Africa (excluding high income)Middle East & North Africa (IDA & IBRD countries)Middle incomeMoldovaMongoliaMontenegroMoroccoMozambiqueMyanmarNauruNepalNetherlandsNew CaledoniaNew ZealandNicaraguaNigerNigeriaNorth AmericaNorwayOECD membersOmanOther small statesPacific island small statesPakistanPanamaPapua New GuineaParaguayPeruPhilippinesPolandPortugalPost-demographic dividendPre-demographic dividendQatarRomaniaRussian FederationRwandaSamoaSao Tome and PrincipeSaudi ArabiaSenegalSerbiaSeychellesSierra LeoneSingaporeSlovak RepublicSloveniaSmall statesSolomon IslandsSomaliaSouth AfricaSouth AsiaSouth Asia (IDA & IBRD)SpainSri LankaSt. Kitts and NevisSt. LuciaSt. Vincent and the GrenadinesSub-Saharan Africa Sub-Saharan Africa (excluding high income)Sub-Saharan Africa (IDA & IBRD countries)SudanSurinameSwedenSwitzerlandSyrian Arab RepublicTajikistanTanzaniaThailandTogoTongaTrinidad and TobagoTunisiaTurkeyTurkmenistanTuvaluUgandaUkraineUnited Arab EmiratesUnited KingdomUnited StatesUpper middle incomeUruguayUzbekistanVanuatuVenezuela, RBVietnamWorldYemen, Rep.ZambiaZimbabwe Timeline:
This timeline shows a graph from 1961 to 2015 of Sub-Saharan Africa (IDA & IBRD countries). No data until 1960. Number of actual observations by date: 55.
Source name:
World Development Indicators
Source organization:
World Bank staff estimates based data from International Monetary Fund's Direction of Trade database.
Categories, topics:
Private Sector, Trade
Last updated:
apr 23, 2017
Indicators value changes by year
Minimum:
44.918
jan 1, 2015
Maximum:
80.879
jan 1, 1979
At the date of observation
Value
Absolute change
Change from previous value
jan 1, 1961
79.79
+79.79
0.0%
jan 1, 1962
79.002
-0.788
-0.99%
jan 1, 1963
78.982
-0.02
-0.02%
jan 1, 1964
77.992
-0.99
-1.25%
jan 1, 1965
73.216
-4.776
-6.12%
jan 1, 1966
72.792
-0.424
-0.58%
jan 1, 1967
74.193
+1.401
1.92%
jan 1, 1968
74.964
+0.77
1.04%
jan 1, 1969
72.029
-2.934
-3.91%
jan 1, 1970
72.434
+0.405
0.56%
jan 1, 1971
73.643
+1.209
1.67%
jan 1, 1972
75.697
+2.054
2.79%
jan 1, 1973
74.362
-1.336
-1.76%
jan 1, 1974
73.655
-0.707
-0.95%
jan 1, 1975
71.835
-1.82
-2.47%
jan 1, 1976
76.531
+4.696
6.54%
jan 1, 1977
79.487
+2.956
3.86%
jan 1, 1978
79.937
+0.45
0.57%
jan 1, 1979
80.879
+0.941
1.18%
jan 1, 1980
78.862
-2.016
-2.49%
jan 1, 1981
73.652
-5.21
-6.61%
jan 1, 1982
78.088
+4.436
6.02%
jan 1, 1983
75.113
-2.975
-3.81%
jan 1, 1984
74.762
-0.351
-0.47%
jan 1, 1985
71.706
-3.056
-4.09%
jan 1, 1986
72.5
+0.794
1.11%
jan 1, 1987
71.31
-1.189
-1.64%
jan 1, 1988
73.267
+1.957
2.74%
jan 1, 1989
72.947
-0.32
-0.44%
jan 1, 1990
71.039
-1.907
-2.61%
jan 1, 1991
70.557
-0.483
-0.68%
jan 1, 1992
72.047
+1.49
2.11%
jan 1, 1993
72.346
+0.299
0.41%
jan 1, 1994
71.018
-1.327
-1.83%
jan 1, 1995
68.244
-2.774
-3.91%
jan 1, 1996
67.086
-1.158
-1.7%
jan 1, 1997
63.466
-3.62
-5.4%
jan 1, 1998
65.889
+2.423
3.82%
jan 1, 1999
73.012
+7.123
10.81%
jan 1, 2000
71.231
-1.781
-2.44%
jan 1, 2001
71.381
+0.15
0.21%
jan 1, 2002
69.521
-1.86
-2.61%
jan 1, 2003
68.598
-0.923
-1.33%
jan 1, 2004
66.436
-2.162
-3.15%
jan 1, 2005
63.224
-3.212
-4.83%
jan 1, 2006
61.642
-1.582
-2.5%
jan 1, 2007
59.921
-1.721
-2.79%
jan 1, 2008
59.024
-0.897
-1.5%
jan 1, 2009
55.503
-3.521
-5.97%
jan 1, 2010
53.417
-2.086
-3.76%
jan 1, 2011
51.978
-1.439
-2.69%
jan 1, 2012
51.289
-0.689
-1.33%
jan 1, 2013
48.88
-2.409
-4.7%
jan 1, 2014
45.919
-2.961
-6.06%
jan 1, 2015
44.918
-1.001
-2.18%
Ranking of countries by current statistics by years


Comments: