29
/
en
AIzaSyAYiBZKx7MnpbEhh9jyipgxe19OcubqV5w
April 1, 2024
122425
Dominican Republic
DOM
true
2
1
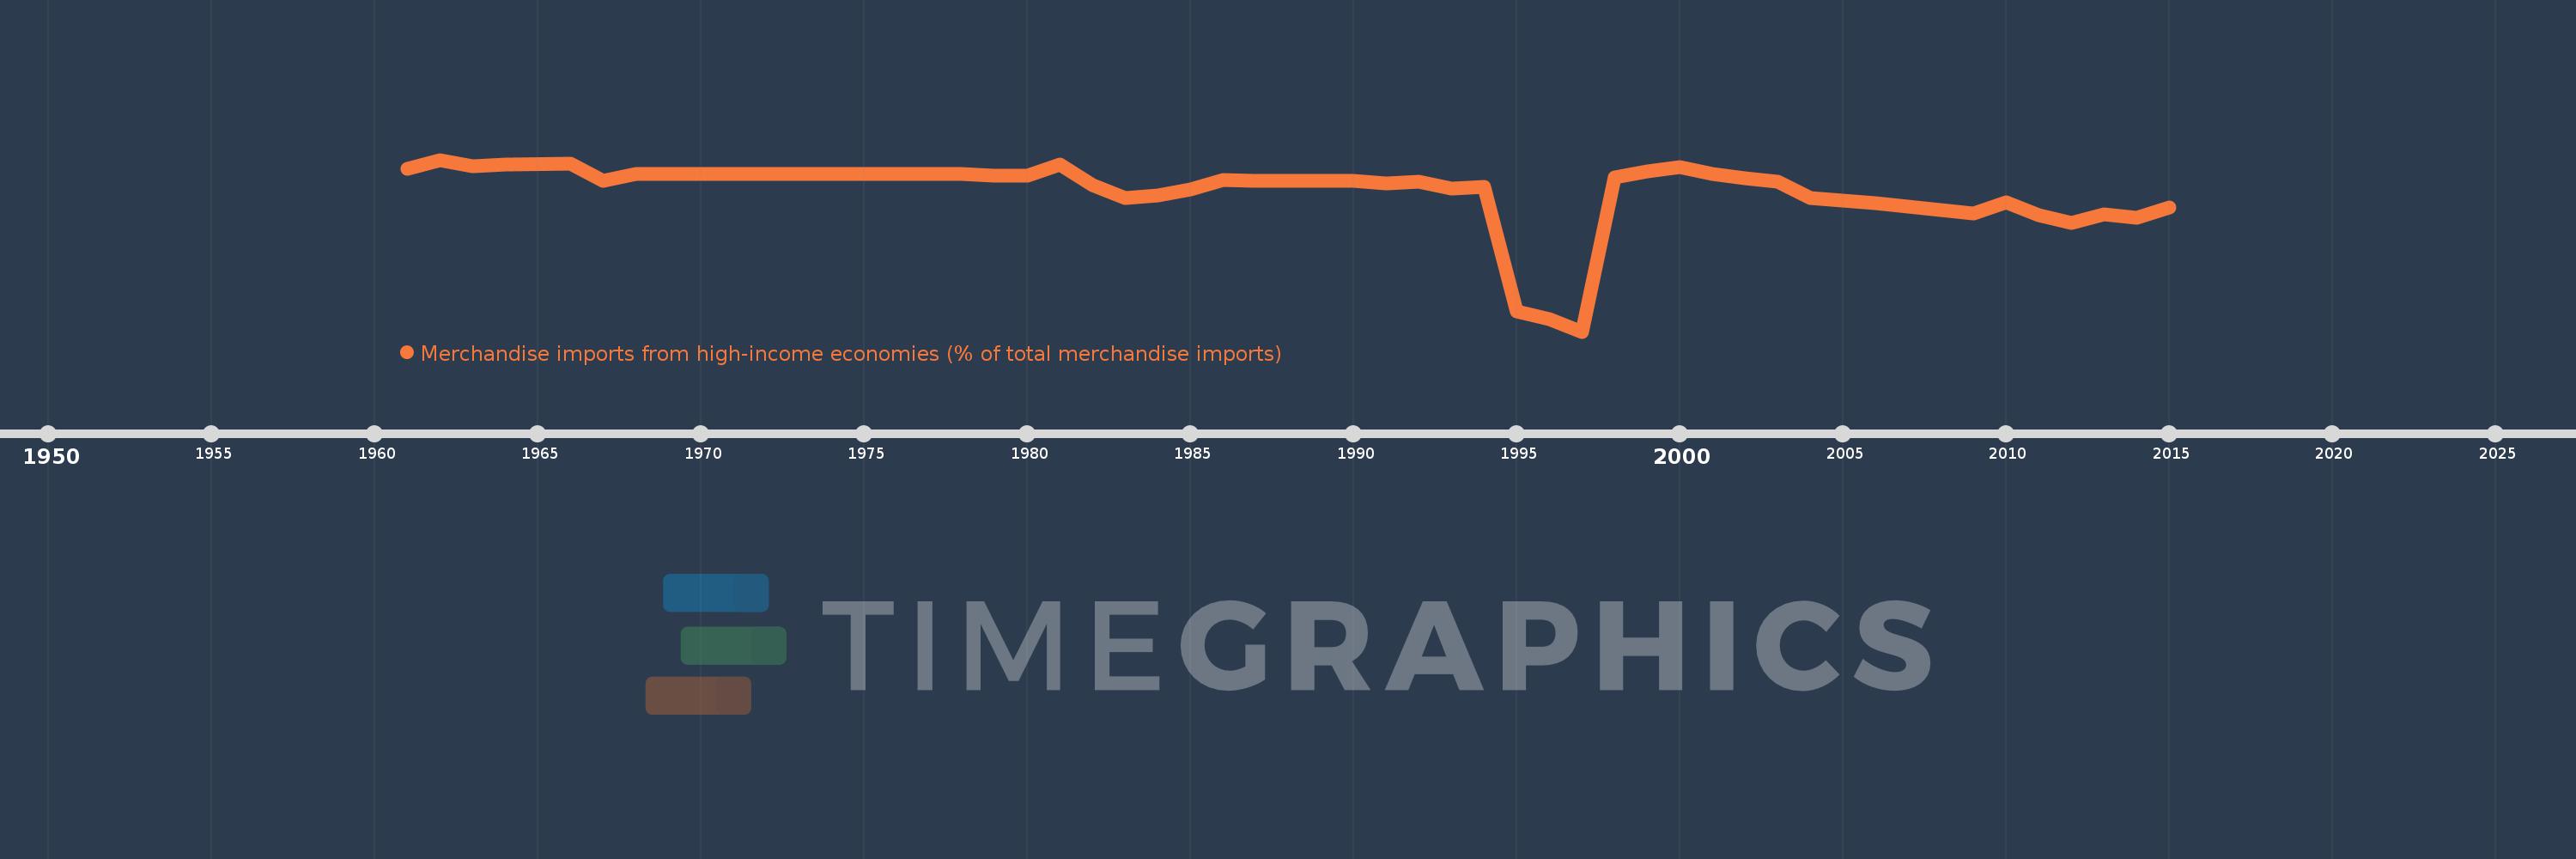
Merchandise imports from high-income economies (% of total merchandise imports)
2015,2014,2013,2012,2011,2010,2009,2008,2007,2006,2005,2004,2003,2002,2001,2000,1999,1998,1997,1996,1995,1994,1993,1992,1991,1990,1989,1988,1987,1986,1985,1984,1983,1982,1981,1980,1979,1978,1969,1968,1967,1966,1964,1963,1962,1961
This statistics in other country:
AfghanistanAlbaniaAlgeriaAngolaAntigua and BarbudaArab WorldArgentinaArmeniaArubaAustraliaAustriaAzerbaijanBahamas, TheBahrainBangladeshBarbadosBelarusBelgiumBelizeBeninBermudaBoliviaBosnia and HerzegovinaBrazilBrunei DarussalamBulgariaBurkina FasoBurundiCabo VerdeCambodiaCameroonCanadaCaribbean small statesCentral African RepublicCentral Europe and the BalticsChadChileChinaColombiaComorosCongo, Dem. Rep.Congo, Rep.Costa RicaCote d'IvoireCroatiaCubaCyprusCzech RepublicDenmarkDjiboutiDominicaDominican RepublicEarly-demographic dividendEast Asia & PacificEast Asia & Pacific (excluding high income)East Asia & Pacific (IDA & IBRD countries)EcuadorEgypt, Arab Rep.El SalvadorEquatorial GuineaEstoniaEthiopiaEuro areaEurope & Central AsiaEurope & Central Asia (excluding high income)Europe & Central Asia (IDA & IBRD countries)European UnionFaroe IslandsFijiFinlandFragile and conflict affected situationsFranceFrench PolynesiaGabonGambia, TheGeorgiaGermanyGhanaGibraltarGreeceGreenlandGrenadaGuamGuatemalaGuineaGuinea-BissauGuyanaHaitiHeavily indebted poor countries (HIPC)High incomeHondurasHong Kong SAR, ChinaHungaryIBRD onlyIcelandIDA & IBRD totalIDA blendIDA onlyIDA totalIndiaIndonesiaIran, Islamic Rep.IraqIrelandIsraelItalyJamaicaJapanJordanKazakhstanKenyaKiribatiKorea, Dem. People’s Rep.Korea, Rep.KosovoKuwaitKyrgyz RepublicLao PDRLate-demographic dividendLatin America & Caribbean Latin America & Caribbean (excluding high income)Latin America & the Caribbean (IDA & IBRD countries)LatviaLeast developed countries: UN classificationLebanonLiberiaLibyaLithuaniaLow & middle incomeLow incomeLower middle incomeLuxembourgMacao SAR, ChinaMacedonia, FYRMadagascarMalawiMalaysiaMaldivesMaliMaltaMauritaniaMauritiusMexicoMiddle East & North AfricaMiddle East & North Africa (excluding high income)Middle East & North Africa (IDA & IBRD countries)Middle incomeMoldovaMongoliaMontenegroMoroccoMozambiqueMyanmarNauruNepalNetherlandsNew CaledoniaNew ZealandNicaraguaNigerNigeriaNorth AmericaNorwayOECD membersOmanOther small statesPacific island small statesPakistanPanamaPapua New GuineaParaguayPeruPhilippinesPolandPortugalPost-demographic dividendPre-demographic dividendQatarRomaniaRussian FederationRwandaSamoaSao Tome and PrincipeSaudi ArabiaSenegalSerbiaSeychellesSierra LeoneSingaporeSlovak RepublicSloveniaSmall statesSolomon IslandsSomaliaSouth AfricaSouth AsiaSouth Asia (IDA & IBRD)SpainSri LankaSt. Kitts and NevisSt. LuciaSt. Vincent and the GrenadinesSub-Saharan Africa Sub-Saharan Africa (excluding high income)Sub-Saharan Africa (IDA & IBRD countries)SudanSurinameSwedenSwitzerlandSyrian Arab RepublicTajikistanTanzaniaThailandTogoTongaTrinidad and TobagoTunisiaTurkeyTurkmenistanTuvaluUgandaUkraineUnited Arab EmiratesUnited KingdomUnited StatesUpper middle incomeUruguayUzbekistanVanuatuVenezuela, RBVietnamWorldYemen, Rep.ZambiaZimbabwe Timeline:
This timeline shows a graph from 1961 to 2015 of Dominican Republic. No data until 1960. Number of actual observations by date: 46.
Source name:
World Development Indicators
Source organization:
World Bank staff estimates based data from International Monetary Fund's Direction of Trade database.
Categories, topics:
Private Sector, Trade
Last updated:
apr 23, 2017
Indicators value changes by year
Minimum:
22.185
jan 1, 1997
Maximum:
93.084
jan 1, 1962
At the date of observation
Value
Absolute change
Change from previous value
jan 1, 1961
89.22
+89.22
0.0%
jan 1, 1962
93.084
+3.863
4.33%
jan 1, 1963
90.362
-2.722
-2.92%
jan 1, 1964
91.152
+0.79
0.87%
jan 1, 1966
91.626
+0.474
0.52%
jan 1, 1967
84.442
-7.184
-7.84%
jan 1, 1968
87.208
+2.766
3.28%
jan 1, 1969
87.24
+0.032
0.04%
jan 1, 1978
87.24
+0.0
0.0%
jan 1, 1979
86.547
-0.694
-0.8%
jan 1, 1980
86.435
-0.112
-0.13%
jan 1, 1981
90.969
+4.534
5.25%
jan 1, 1982
82.567
-8.402
-9.24%
jan 1, 1983
77.448
-5.119
-6.2%
jan 1, 1984
78.462
+1.014
1.31%
jan 1, 1985
80.796
+2.333
2.97%
jan 1, 1986
84.817
+4.021
4.98%
jan 1, 1987
84.479
-0.338
-0.4%
jan 1, 1988
84.479
0.0
0.0%
jan 1, 1989
84.479
0.0
0.0%
jan 1, 1990
84.479
+0.0
0.0%
jan 1, 1991
83.257
-1.222
-1.45%
jan 1, 1992
84.163
+0.906
1.09%
jan 1, 1993
81.364
-2.799
-3.33%
jan 1, 1994
81.94
+0.576
0.71%
jan 1, 1995
30.513
-51.427
-62.76%
jan 1, 1996
27.37
-3.142
-10.3%
jan 1, 1997
22.185
-5.186
-18.95%
jan 1, 1998
85.924
+63.739
287.31%
jan 1, 1999
88.475
+2.552
2.97%
jan 1, 2000
90.159
+1.684
1.9%
jan 1, 2001
87.246
-2.914
-3.23%
jan 1, 2002
85.617
-1.629
-1.87%
jan 1, 2003
84.092
-1.525
-1.78%
jan 1, 2004
77.181
-6.911
-8.22%
jan 1, 2005
76.105
-1.076
-1.39%
jan 1, 2006
75.283
-0.822
-1.08%
jan 1, 2007
73.918
-1.366
-1.81%
jan 1, 2008
72.251
-1.667
-2.26%
jan 1, 2009
70.945
-1.306
-1.81%
jan 1, 2010
75.695
+4.75
6.7%
jan 1, 2011
70.208
-5.487
-7.25%
jan 1, 2012
67.02
-3.188
-4.54%
jan 1, 2013
70.619
+3.599
5.37%
jan 1, 2014
69.054
-1.565
-2.22%
jan 1, 2015
73.396
+4.342
6.29%
Ranking of countries by current statistics by years


Comments: