29
/
en
AIzaSyAYiBZKx7MnpbEhh9jyipgxe19OcubqV5w
April 1, 2024
93856
Bulgaria
BGR
true
2
1
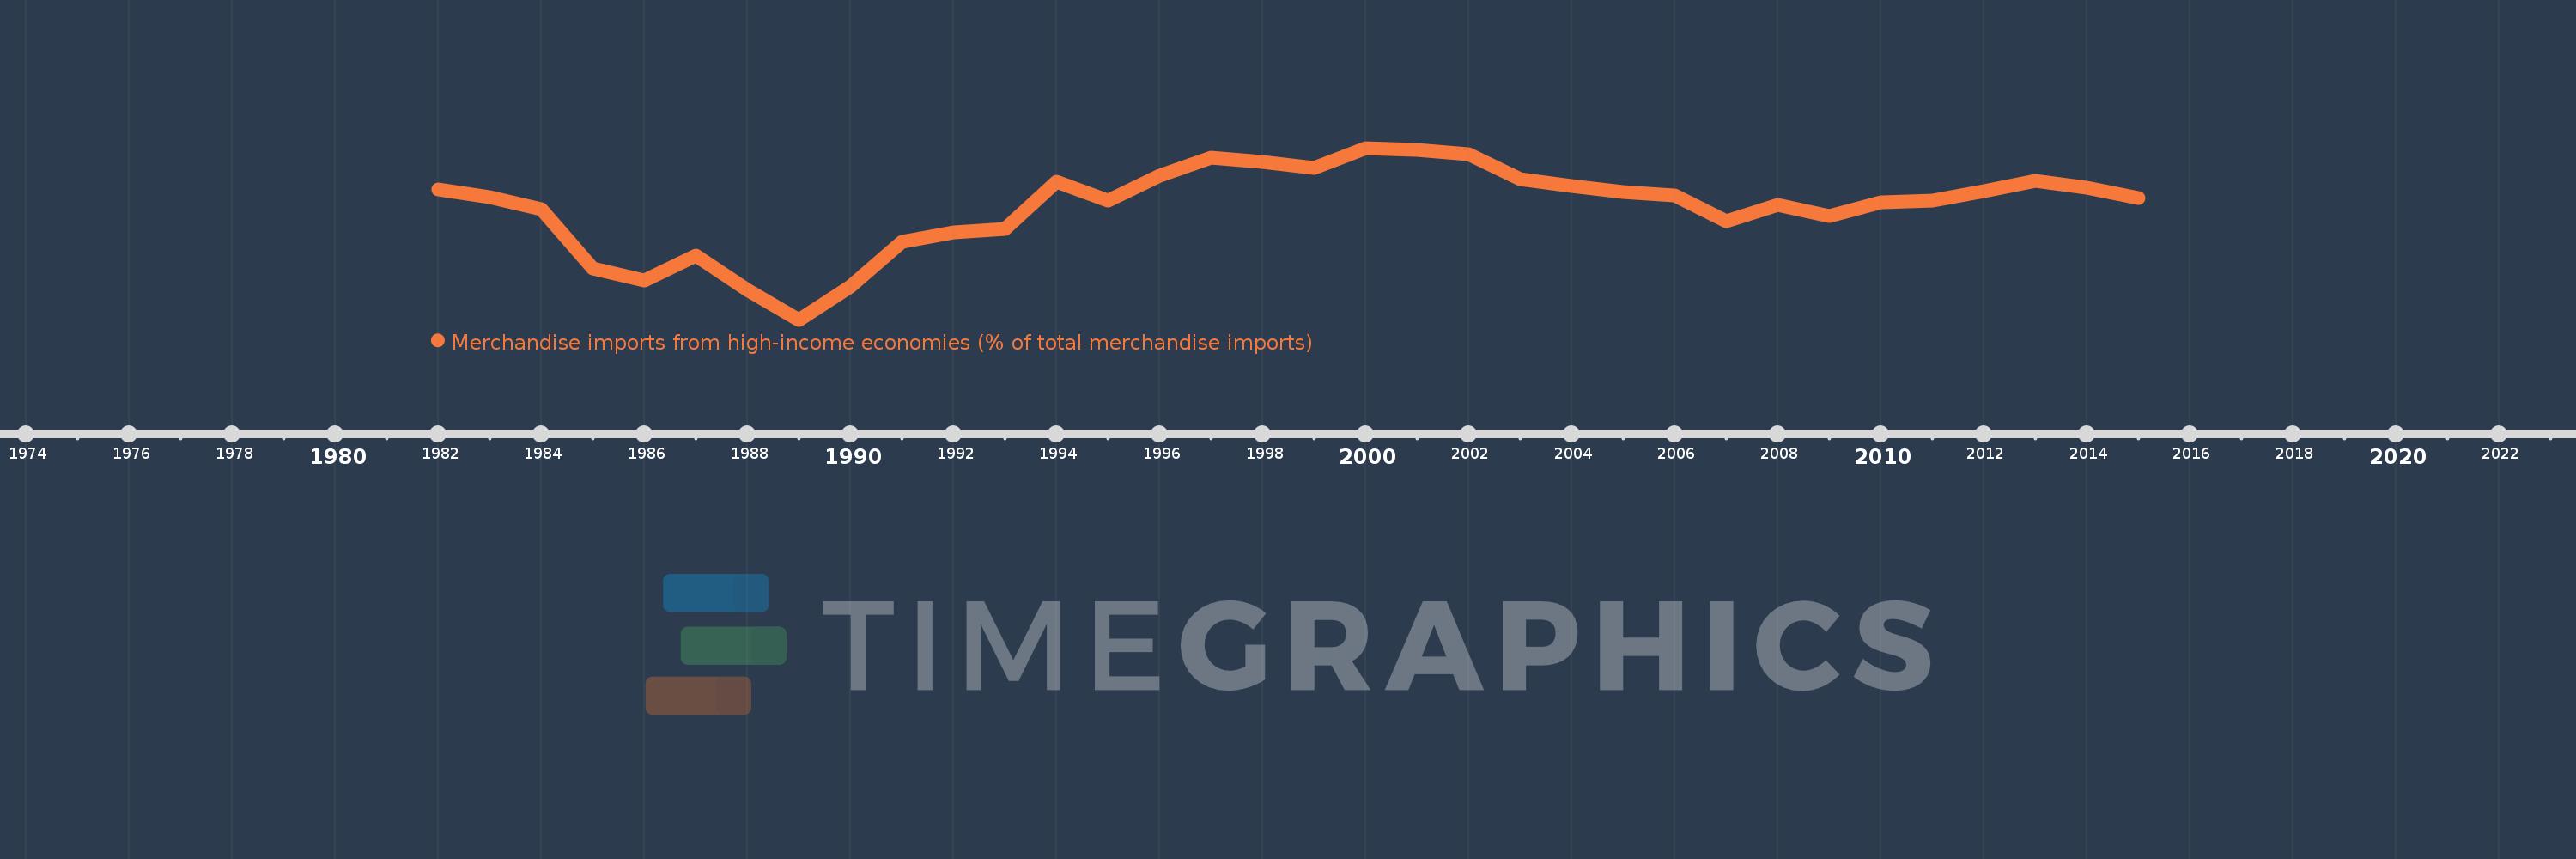
Merchandise imports from high-income economies (% of total merchandise imports)
2015,2014,2013,2012,2011,2010,2009,2008,2007,2006,2005,2004,2003,2002,2001,2000,1999,1998,1997,1996,1995,1994,1993,1992,1991,1990,1989,1988,1987,1986,1985,1984,1983,1982
This statistics in other country:
AfghanistanAlbaniaAlgeriaAngolaAntigua and BarbudaArab WorldArgentinaArmeniaArubaAustraliaAustriaAzerbaijanBahamas, TheBahrainBangladeshBarbadosBelarusBelgiumBelizeBeninBermudaBoliviaBosnia and HerzegovinaBrazilBrunei DarussalamBulgariaBurkina FasoBurundiCabo VerdeCambodiaCameroonCanadaCaribbean small statesCentral African RepublicCentral Europe and the BalticsChadChileChinaColombiaComorosCongo, Dem. Rep.Congo, Rep.Costa RicaCote d'IvoireCroatiaCubaCyprusCzech RepublicDenmarkDjiboutiDominicaDominican RepublicEarly-demographic dividendEast Asia & PacificEast Asia & Pacific (excluding high income)East Asia & Pacific (IDA & IBRD countries)EcuadorEgypt, Arab Rep.El SalvadorEquatorial GuineaEstoniaEthiopiaEuro areaEurope & Central AsiaEurope & Central Asia (excluding high income)Europe & Central Asia (IDA & IBRD countries)European UnionFaroe IslandsFijiFinlandFragile and conflict affected situationsFranceFrench PolynesiaGabonGambia, TheGeorgiaGermanyGhanaGibraltarGreeceGreenlandGrenadaGuamGuatemalaGuineaGuinea-BissauGuyanaHaitiHeavily indebted poor countries (HIPC)High incomeHondurasHong Kong SAR, ChinaHungaryIBRD onlyIcelandIDA & IBRD totalIDA blendIDA onlyIDA totalIndiaIndonesiaIran, Islamic Rep.IraqIrelandIsraelItalyJamaicaJapanJordanKazakhstanKenyaKiribatiKorea, Dem. People’s Rep.Korea, Rep.KosovoKuwaitKyrgyz RepublicLao PDRLate-demographic dividendLatin America & Caribbean Latin America & Caribbean (excluding high income)Latin America & the Caribbean (IDA & IBRD countries)LatviaLeast developed countries: UN classificationLebanonLiberiaLibyaLithuaniaLow & middle incomeLow incomeLower middle incomeLuxembourgMacao SAR, ChinaMacedonia, FYRMadagascarMalawiMalaysiaMaldivesMaliMaltaMauritaniaMauritiusMexicoMiddle East & North AfricaMiddle East & North Africa (excluding high income)Middle East & North Africa (IDA & IBRD countries)Middle incomeMoldovaMongoliaMontenegroMoroccoMozambiqueMyanmarNauruNepalNetherlandsNew CaledoniaNew ZealandNicaraguaNigerNigeriaNorth AmericaNorwayOECD membersOmanOther small statesPacific island small statesPakistanPanamaPapua New GuineaParaguayPeruPhilippinesPolandPortugalPost-demographic dividendPre-demographic dividendQatarRomaniaRussian FederationRwandaSamoaSao Tome and PrincipeSaudi ArabiaSenegalSerbiaSeychellesSierra LeoneSingaporeSlovak RepublicSloveniaSmall statesSolomon IslandsSomaliaSouth AfricaSouth AsiaSouth Asia (IDA & IBRD)SpainSri LankaSt. Kitts and NevisSt. LuciaSt. Vincent and the GrenadinesSub-Saharan Africa Sub-Saharan Africa (excluding high income)Sub-Saharan Africa (IDA & IBRD countries)SudanSurinameSwedenSwitzerlandSyrian Arab RepublicTajikistanTanzaniaThailandTogoTongaTrinidad and TobagoTunisiaTurkeyTurkmenistanTuvaluUgandaUkraineUnited Arab EmiratesUnited KingdomUnited StatesUpper middle incomeUruguayUzbekistanVanuatuVenezuela, RBVietnamWorldYemen, Rep.ZambiaZimbabwe Timeline:
This timeline shows a graph from 1982 to 2015 of Bulgaria. No data until 1981. Number of actual observations by date: 34.
Source name:
World Development Indicators
Source organization:
World Bank staff estimates based data from International Monetary Fund's Direction of Trade database.
Categories, topics:
Private Sector, Trade
Last updated:
apr 23, 2017
Indicators value changes by year
Minimum:
53.452
jan 1, 1989
Maximum:
82.505
jan 1, 2000
At the date of observation
Value
Absolute change
Change from previous value
jan 1, 1982
75.513
+75.513
0.0%
jan 1, 1983
74.232
-1.282
-1.7%
jan 1, 1984
72.085
-2.146
-2.89%
jan 1, 1985
62.117
-9.968
-13.83%
jan 1, 1986
60.078
-2.039
-3.28%
jan 1, 1987
64.256
+4.178
6.95%
jan 1, 1988
58.519
-5.737
-8.93%
jan 1, 1989
53.452
-5.067
-8.66%
jan 1, 1990
59.119
+5.667
10.6%
jan 1, 1991
66.607
+7.488
12.67%
jan 1, 1992
68.165
+1.559
2.34%
jan 1, 1993
68.801
+0.636
0.93%
jan 1, 1994
76.779
+7.978
11.6%
jan 1, 1995
73.656
-3.123
-4.07%
jan 1, 1996
77.789
+4.133
5.61%
jan 1, 1997
80.85
+3.061
3.93%
jan 1, 1998
80.101
-0.749
-0.93%
jan 1, 1999
79.125
-0.976
-1.22%
jan 1, 2000
82.505
+3.379
4.27%
jan 1, 2001
82.13
-0.375
-0.45%
jan 1, 2002
81.372
-0.758
-0.92%
jan 1, 2003
77.238
-4.133
-5.08%
jan 1, 2004
76.066
-1.173
-1.52%
jan 1, 2005
75.054
-1.012
-1.33%
jan 1, 2006
74.424
-0.63
-0.84%
jan 1, 2007
70.136
-4.288
-5.76%
jan 1, 2008
72.827
+2.692
3.84%
jan 1, 2009
70.969
-1.859
-2.55%
jan 1, 2010
73.282
+2.313
3.26%
jan 1, 2011
73.593
+0.312
0.43%
jan 1, 2012
75.156
+1.563
2.12%
jan 1, 2013
76.903
+1.747
2.32%
jan 1, 2014
75.752
-1.151
-1.5%
jan 1, 2015
73.986
-1.766
-2.33%
Ranking of countries by current statistics by years


Comments: