29
/
en
AIzaSyAYiBZKx7MnpbEhh9jyipgxe19OcubqV5w
April 1, 2024
53584
Other small states
OSS
false
2
1
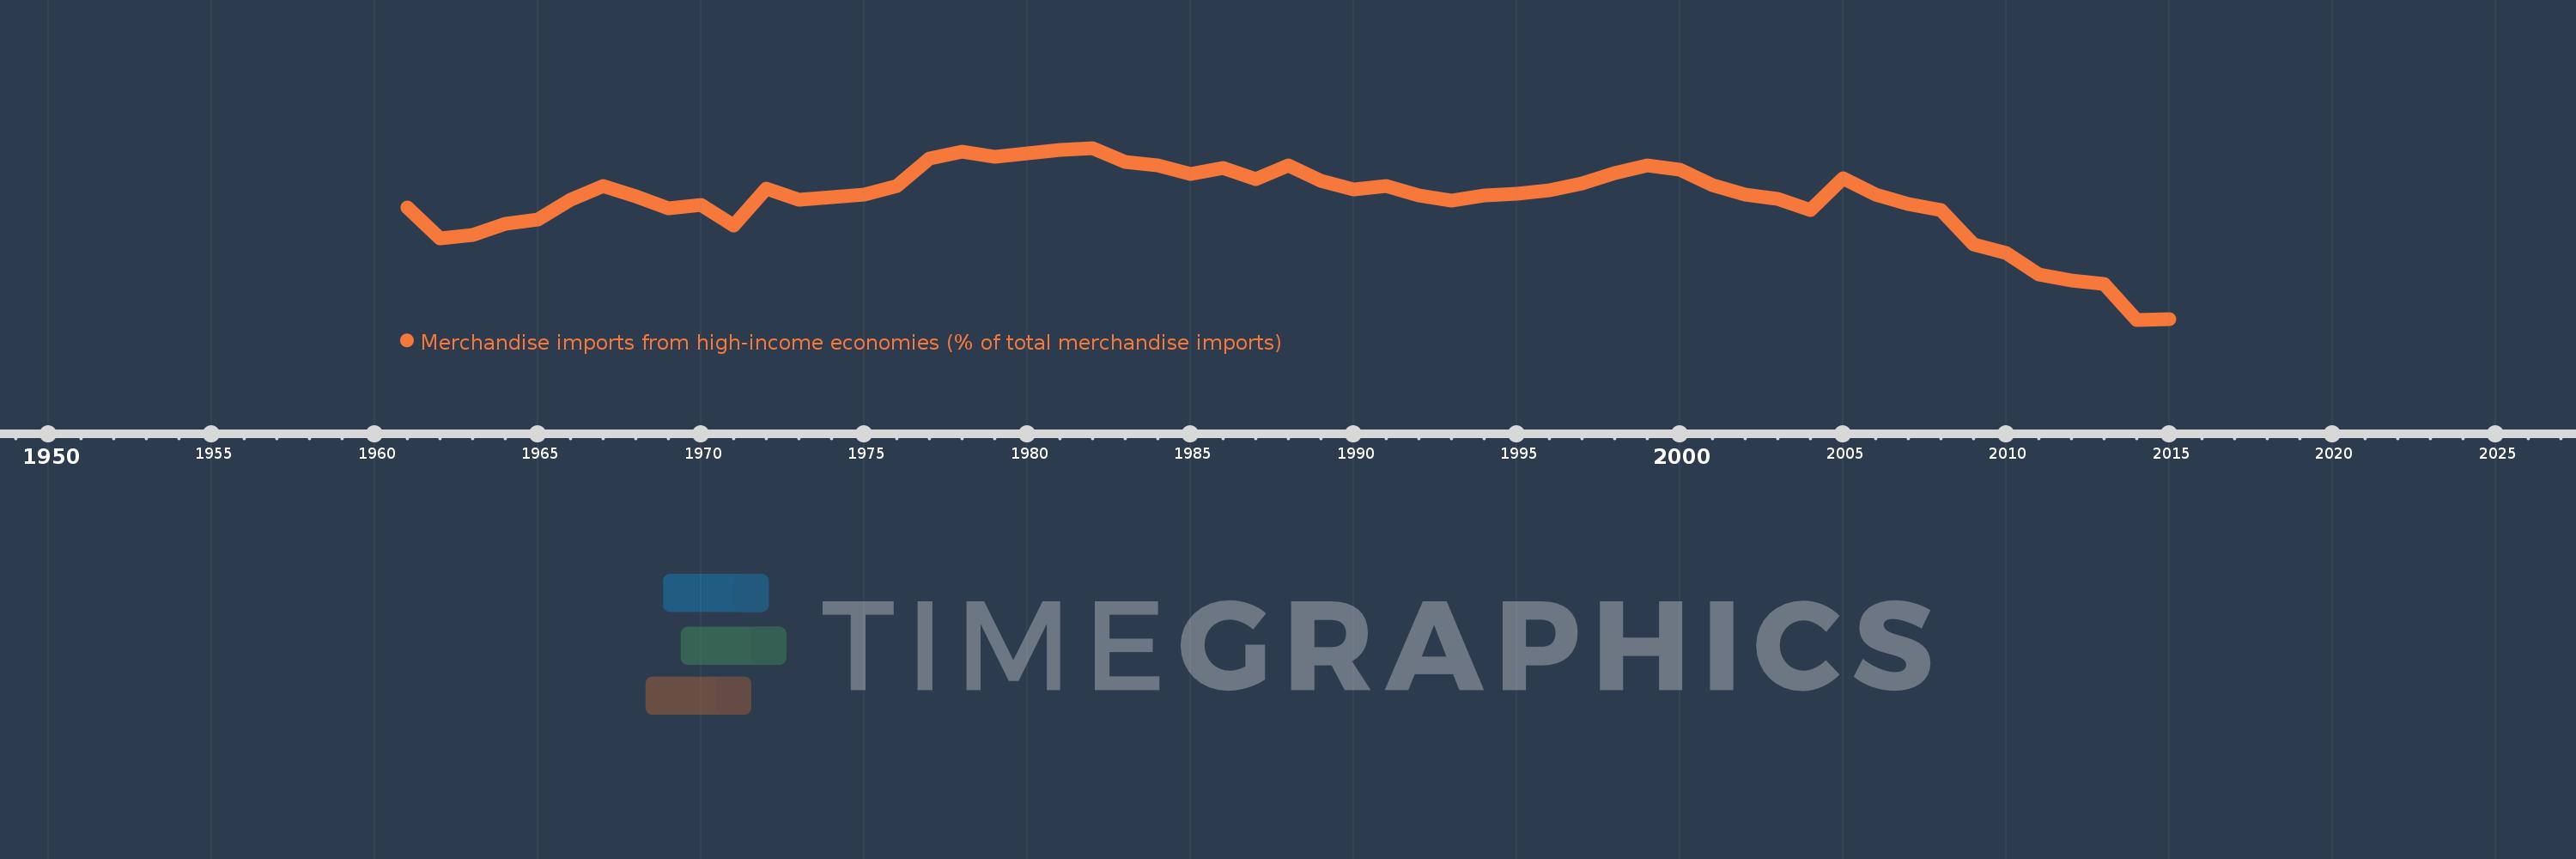
Merchandise imports from high-income economies (% of total merchandise imports)
2015,2014,2013,2012,2011,2010,2009,2008,2007,2006,2005,2004,2003,2002,2001,2000,1999,1998,1997,1996,1995,1994,1993,1992,1991,1990,1989,1988,1987,1986,1985,1984,1983,1982,1981,1980,1979,1978,1977,1976,1975,1974,1973,1972,1971,1970,1969,1968,1967,1966,1965,1964,1963,1962,1961
This statistics in other country:
AfghanistanAlbaniaAlgeriaAngolaAntigua and BarbudaArab WorldArgentinaArmeniaArubaAustraliaAustriaAzerbaijanBahamas, TheBahrainBangladeshBarbadosBelarusBelgiumBelizeBeninBermudaBoliviaBosnia and HerzegovinaBrazilBrunei DarussalamBulgariaBurkina FasoBurundiCabo VerdeCambodiaCameroonCanadaCaribbean small statesCentral African RepublicCentral Europe and the BalticsChadChileChinaColombiaComorosCongo, Dem. Rep.Congo, Rep.Costa RicaCote d'IvoireCroatiaCubaCyprusCzech RepublicDenmarkDjiboutiDominicaDominican RepublicEarly-demographic dividendEast Asia & PacificEast Asia & Pacific (excluding high income)East Asia & Pacific (IDA & IBRD countries)EcuadorEgypt, Arab Rep.El SalvadorEquatorial GuineaEstoniaEthiopiaEuro areaEurope & Central AsiaEurope & Central Asia (excluding high income)Europe & Central Asia (IDA & IBRD countries)European UnionFaroe IslandsFijiFinlandFragile and conflict affected situationsFranceFrench PolynesiaGabonGambia, TheGeorgiaGermanyGhanaGibraltarGreeceGreenlandGrenadaGuamGuatemalaGuineaGuinea-BissauGuyanaHaitiHeavily indebted poor countries (HIPC)High incomeHondurasHong Kong SAR, ChinaHungaryIBRD onlyIcelandIDA & IBRD totalIDA blendIDA onlyIDA totalIndiaIndonesiaIran, Islamic Rep.IraqIrelandIsraelItalyJamaicaJapanJordanKazakhstanKenyaKiribatiKorea, Dem. People’s Rep.Korea, Rep.KosovoKuwaitKyrgyz RepublicLao PDRLate-demographic dividendLatin America & Caribbean Latin America & Caribbean (excluding high income)Latin America & the Caribbean (IDA & IBRD countries)LatviaLeast developed countries: UN classificationLebanonLiberiaLibyaLithuaniaLow & middle incomeLow incomeLower middle incomeLuxembourgMacao SAR, ChinaMacedonia, FYRMadagascarMalawiMalaysiaMaldivesMaliMaltaMauritaniaMauritiusMexicoMiddle East & North AfricaMiddle East & North Africa (excluding high income)Middle East & North Africa (IDA & IBRD countries)Middle incomeMoldovaMongoliaMontenegroMoroccoMozambiqueMyanmarNauruNepalNetherlandsNew CaledoniaNew ZealandNicaraguaNigerNigeriaNorth AmericaNorwayOECD membersOmanOther small statesPacific island small statesPakistanPanamaPapua New GuineaParaguayPeruPhilippinesPolandPortugalPost-demographic dividendPre-demographic dividendQatarRomaniaRussian FederationRwandaSamoaSao Tome and PrincipeSaudi ArabiaSenegalSerbiaSeychellesSierra LeoneSingaporeSlovak RepublicSloveniaSmall statesSolomon IslandsSomaliaSouth AfricaSouth AsiaSouth Asia (IDA & IBRD)SpainSri LankaSt. Kitts and NevisSt. LuciaSt. Vincent and the GrenadinesSub-Saharan Africa Sub-Saharan Africa (excluding high income)Sub-Saharan Africa (IDA & IBRD countries)SudanSurinameSwedenSwitzerlandSyrian Arab RepublicTajikistanTanzaniaThailandTogoTongaTrinidad and TobagoTunisiaTurkeyTurkmenistanTuvaluUgandaUkraineUnited Arab EmiratesUnited KingdomUnited StatesUpper middle incomeUruguayUzbekistanVanuatuVenezuela, RBVietnamWorldYemen, Rep.ZambiaZimbabwe Timeline:
This timeline shows a graph from 1961 to 2015 of Other small states. No data until 1960. Number of actual observations by date: 55.
Source name:
World Development Indicators
Source organization:
World Bank staff estimates based data from International Monetary Fund's Direction of Trade database.
Categories, topics:
Private Sector, Trade
Last updated:
apr 23, 2017
Indicators value changes by year
Minimum:
69.609
jan 1, 2014
Maximum:
86.805
jan 1, 1982
At the date of observation
Value
Absolute change
Change from previous value
jan 1, 1961
80.858
+80.858
0.0%
jan 1, 1962
77.74
-3.119
-3.86%
jan 1, 1963
78.108
+0.368
0.47%
jan 1, 1964
79.173
+1.066
1.36%
jan 1, 1965
79.677
+0.503
0.64%
jan 1, 1966
81.592
+1.915
2.4%
jan 1, 1967
83.025
+1.433
1.76%
jan 1, 1968
81.948
-1.077
-1.3%
jan 1, 1969
80.738
-1.209
-1.48%
jan 1, 1970
81.066
+0.328
0.41%
jan 1, 1971
79.01
-2.056
-2.54%
jan 1, 1972
82.739
+3.729
4.72%
jan 1, 1973
81.643
-1.096
-1.32%
jan 1, 1974
81.883
+0.24
0.29%
jan 1, 1975
82.146
+0.263
0.32%
jan 1, 1976
83.031
+0.885
1.08%
jan 1, 1977
85.781
+2.75
3.31%
jan 1, 1978
86.402
+0.621
0.72%
jan 1, 1979
85.949
-0.453
-0.52%
jan 1, 1980
86.286
+0.338
0.39%
jan 1, 1981
86.565
+0.279
0.32%
jan 1, 1982
86.805
+0.24
0.28%
jan 1, 1983
85.379
-1.426
-1.64%
jan 1, 1984
85.059
-0.321
-0.38%
jan 1, 1985
84.238
-0.821
-0.96%
jan 1, 1986
84.797
+0.559
0.66%
jan 1, 1987
83.664
-1.133
-1.34%
jan 1, 1988
85.03
+1.366
1.63%
jan 1, 1989
83.516
-1.514
-1.78%
jan 1, 1990
82.651
-0.865
-1.04%
jan 1, 1991
83.018
+0.366
0.44%
jan 1, 1992
82.069
-0.948
-1.14%
jan 1, 1993
81.496
-0.573
-0.7%
jan 1, 1994
82.054
+0.558
0.69%
jan 1, 1995
82.264
+0.21
0.26%
jan 1, 1996
82.556
+0.293
0.36%
jan 1, 1997
83.235
+0.678
0.82%
jan 1, 1998
84.314
+1.08
1.3%
jan 1, 1999
85.09
+0.775
0.92%
jan 1, 2000
84.619
-0.47
-0.55%
jan 1, 2001
83.119
-1.5
-1.77%
jan 1, 2002
82.147
-0.972
-1.17%
jan 1, 2003
81.748
-0.399
-0.49%
jan 1, 2004
80.56
-1.188
-1.45%
jan 1, 2005
83.793
+3.233
4.01%
jan 1, 2006
82.166
-1.627
-1.94%
jan 1, 2007
81.157
-1.01
-1.23%
jan 1, 2008
80.622
-0.535
-0.66%
jan 1, 2009
77.145
-3.477
-4.31%
jan 1, 2010
76.318
-0.827
-1.07%
jan 1, 2011
74.171
-2.147
-2.81%
jan 1, 2012
73.559
-0.612
-0.83%
jan 1, 2013
73.23
-0.329
-0.45%
jan 1, 2014
69.609
-3.621
-4.95%
jan 1, 2015
69.633
+0.024
0.04%
Ranking of countries by current statistics by years


Comments: