29
/
en
AIzaSyAYiBZKx7MnpbEhh9jyipgxe19OcubqV5w
April 1, 2024
153794
Iceland
ISL
true
2
1
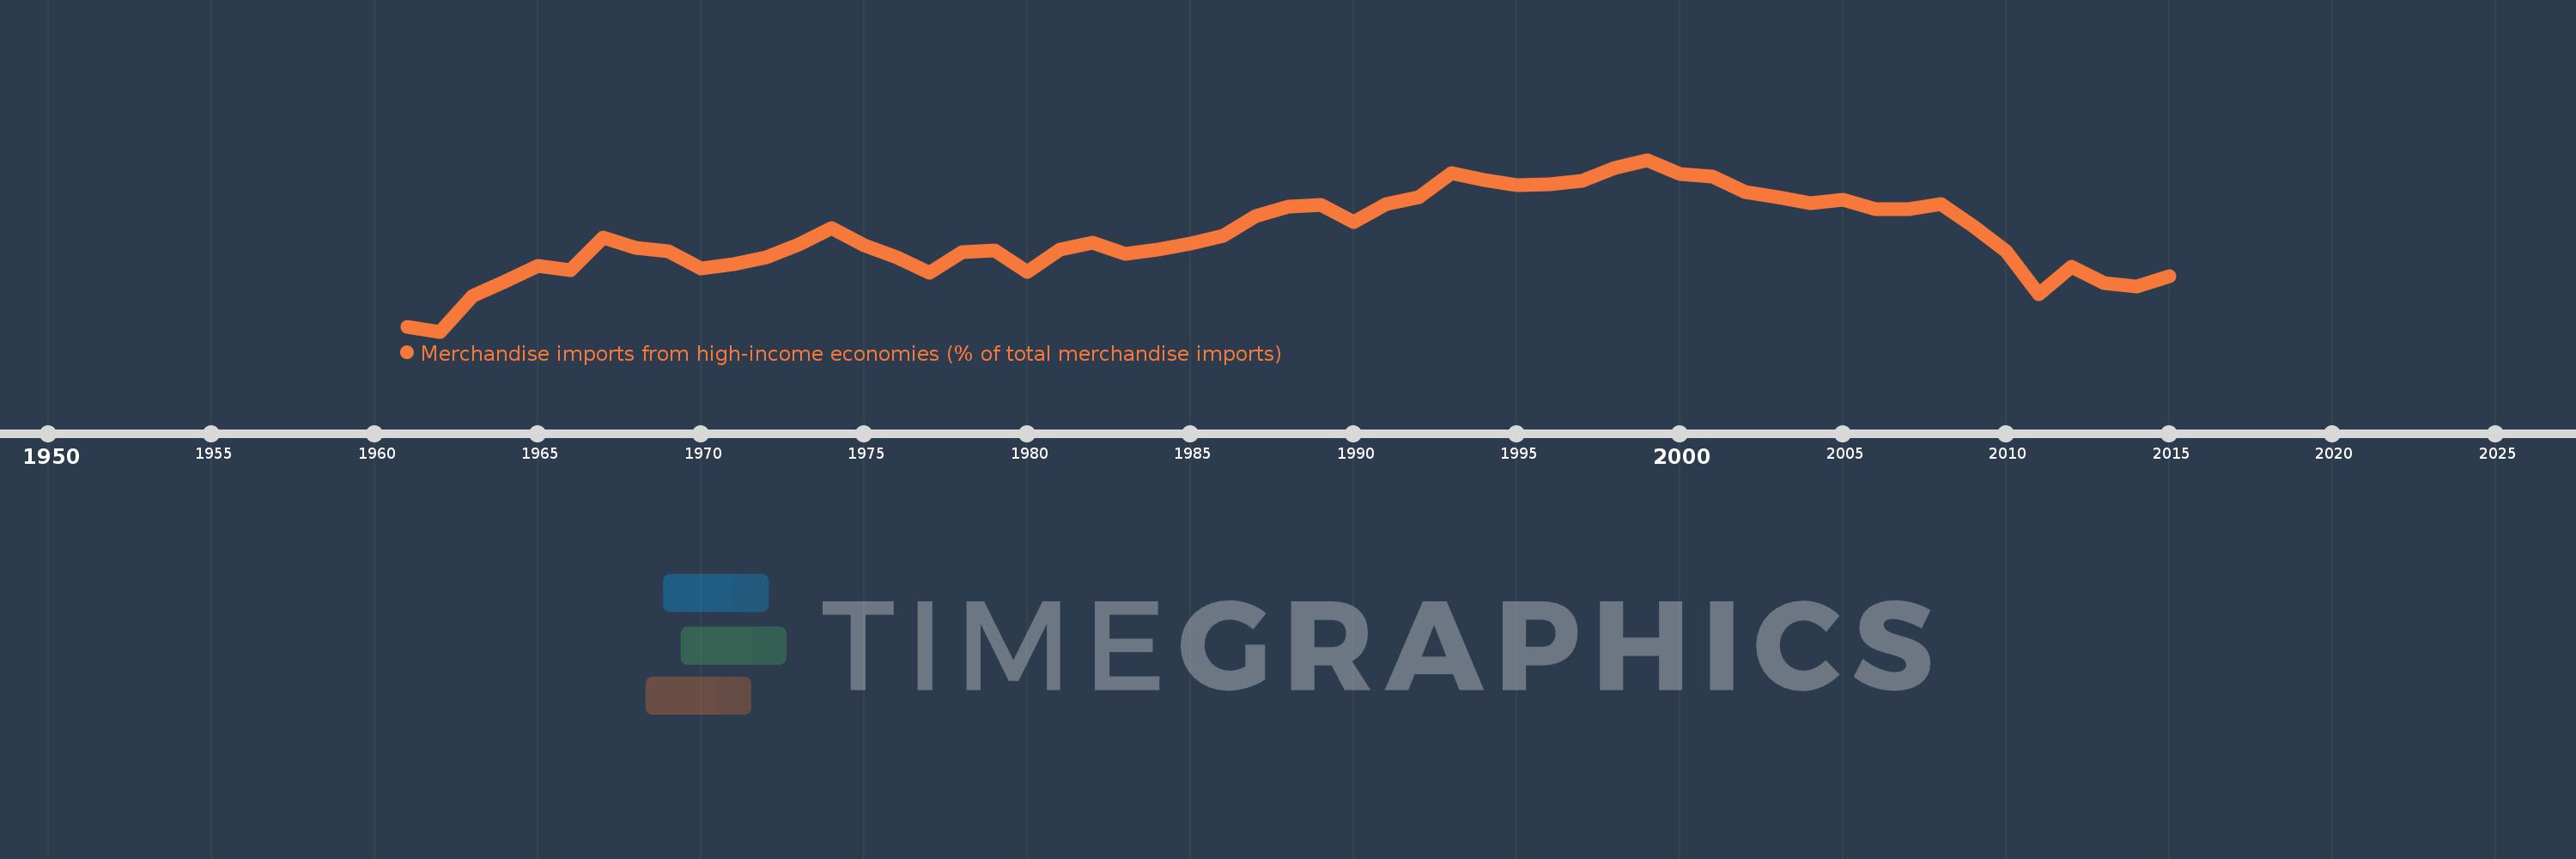
Merchandise imports from high-income economies (% of total merchandise imports)
2015,2014,2013,2012,2011,2010,2009,2008,2007,2006,2005,2004,2003,2002,2001,2000,1999,1998,1997,1996,1995,1994,1993,1992,1991,1990,1989,1988,1987,1986,1985,1984,1983,1982,1981,1980,1979,1978,1977,1976,1975,1974,1973,1972,1971,1970,1969,1968,1967,1966,1965,1964,1963,1962,1961
This statistics in other country:
AfghanistanAlbaniaAlgeriaAngolaAntigua and BarbudaArab WorldArgentinaArmeniaArubaAustraliaAustriaAzerbaijanBahamas, TheBahrainBangladeshBarbadosBelarusBelgiumBelizeBeninBermudaBoliviaBosnia and HerzegovinaBrazilBrunei DarussalamBulgariaBurkina FasoBurundiCabo VerdeCambodiaCameroonCanadaCaribbean small statesCentral African RepublicCentral Europe and the BalticsChadChileChinaColombiaComorosCongo, Dem. Rep.Congo, Rep.Costa RicaCote d'IvoireCroatiaCubaCyprusCzech RepublicDenmarkDjiboutiDominicaDominican RepublicEarly-demographic dividendEast Asia & PacificEast Asia & Pacific (excluding high income)East Asia & Pacific (IDA & IBRD countries)EcuadorEgypt, Arab Rep.El SalvadorEquatorial GuineaEstoniaEthiopiaEuro areaEurope & Central AsiaEurope & Central Asia (excluding high income)Europe & Central Asia (IDA & IBRD countries)European UnionFaroe IslandsFijiFinlandFragile and conflict affected situationsFranceFrench PolynesiaGabonGambia, TheGeorgiaGermanyGhanaGibraltarGreeceGreenlandGrenadaGuamGuatemalaGuineaGuinea-BissauGuyanaHaitiHeavily indebted poor countries (HIPC)High incomeHondurasHong Kong SAR, ChinaHungaryIBRD onlyIcelandIDA & IBRD totalIDA blendIDA onlyIDA totalIndiaIndonesiaIran, Islamic Rep.IraqIrelandIsraelItalyJamaicaJapanJordanKazakhstanKenyaKiribatiKorea, Dem. People’s Rep.Korea, Rep.KosovoKuwaitKyrgyz RepublicLao PDRLate-demographic dividendLatin America & Caribbean Latin America & Caribbean (excluding high income)Latin America & the Caribbean (IDA & IBRD countries)LatviaLeast developed countries: UN classificationLebanonLiberiaLibyaLithuaniaLow & middle incomeLow incomeLower middle incomeLuxembourgMacao SAR, ChinaMacedonia, FYRMadagascarMalawiMalaysiaMaldivesMaliMaltaMauritaniaMauritiusMexicoMiddle East & North AfricaMiddle East & North Africa (excluding high income)Middle East & North Africa (IDA & IBRD countries)Middle incomeMoldovaMongoliaMontenegroMoroccoMozambiqueMyanmarNauruNepalNetherlandsNew CaledoniaNew ZealandNicaraguaNigerNigeriaNorth AmericaNorwayOECD membersOmanOther small statesPacific island small statesPakistanPanamaPapua New GuineaParaguayPeruPhilippinesPolandPortugalPost-demographic dividendPre-demographic dividendQatarRomaniaRussian FederationRwandaSamoaSao Tome and PrincipeSaudi ArabiaSenegalSerbiaSeychellesSierra LeoneSingaporeSlovak RepublicSloveniaSmall statesSolomon IslandsSomaliaSouth AfricaSouth AsiaSouth Asia (IDA & IBRD)SpainSri LankaSt. Kitts and NevisSt. LuciaSt. Vincent and the GrenadinesSub-Saharan Africa Sub-Saharan Africa (excluding high income)Sub-Saharan Africa (IDA & IBRD countries)SudanSurinameSwedenSwitzerlandSyrian Arab RepublicTajikistanTanzaniaThailandTogoTongaTrinidad and TobagoTunisiaTurkeyTurkmenistanTuvaluUgandaUkraineUnited Arab EmiratesUnited KingdomUnited StatesUpper middle incomeUruguayUzbekistanVanuatuVenezuela, RBVietnamWorldYemen, Rep.ZambiaZimbabwe Timeline:
This timeline shows a graph from 1961 to 2015 of Iceland. No data until 1960. Number of actual observations by date: 55.
Source name:
World Development Indicators
Source organization:
World Bank staff estimates based data from International Monetary Fund's Direction of Trade database.
Categories, topics:
Private Sector, Trade
Last updated:
apr 23, 2017
Indicators value changes by year
At the date of observation
Value
Absolute change
Change from previous value
jan 1, 1961
74.374
+74.374
0.0%
jan 1, 1962
73.72
-0.654
-0.88%
jan 1, 1963
78.539
+4.82
6.54%
jan 1, 1964
80.568
+2.029
2.58%
jan 1, 1965
82.632
+2.064
2.56%
jan 1, 1966
82.083
-0.549
-0.66%
jan 1, 1967
86.558
+4.475
5.45%
jan 1, 1968
85.139
-1.418
-1.64%
jan 1, 1969
84.621
-0.518
-0.61%
jan 1, 1970
82.376
-2.245
-2.65%
jan 1, 1971
82.866
+0.49
0.59%
jan 1, 1972
83.802
+0.935
1.13%
jan 1, 1973
85.6
+1.798
2.15%
jan 1, 1974
87.788
+2.189
2.56%
jan 1, 1975
85.446
-2.342
-2.67%
jan 1, 1976
83.84
-1.606
-1.88%
jan 1, 1977
81.788
-2.052
-2.45%
jan 1, 1978
84.505
+2.718
3.32%
jan 1, 1979
84.767
+0.261
0.31%
jan 1, 1980
81.843
-2.924
-3.45%
jan 1, 1981
84.926
+3.083
3.77%
jan 1, 1982
85.856
+0.93
1.1%
jan 1, 1983
84.309
-1.547
-1.8%
jan 1, 1984
84.953
+0.644
0.76%
jan 1, 1985
85.752
+0.799
0.94%
jan 1, 1986
86.806
+1.053
1.23%
jan 1, 1987
89.407
+2.601
3.0%
jan 1, 1988
90.785
+1.378
1.54%
jan 1, 1989
91.012
+0.227
0.25%
jan 1, 1990
88.623
-2.388
-2.62%
jan 1, 1991
91.049
+2.426
2.74%
jan 1, 1992
92.073
+1.024
1.12%
jan 1, 1993
95.372
+3.3
3.58%
jan 1, 1994
94.399
-0.973
-1.02%
jan 1, 1995
93.725
-0.675
-0.71%
jan 1, 1996
93.78
+0.055
0.06%
jan 1, 1997
94.216
+0.436
0.46%
jan 1, 1998
95.984
+1.768
1.88%
jan 1, 1999
97.13
+1.146
1.19%
jan 1, 2000
95.209
-1.921
-1.98%
jan 1, 2001
94.811
-0.398
-0.42%
jan 1, 2002
92.786
-2.025
-2.14%
jan 1, 2003
92.056
-0.731
-0.79%
jan 1, 2004
91.271
-0.785
-0.85%
jan 1, 2005
91.659
+0.388
0.42%
jan 1, 2006
90.452
-1.206
-1.32%
jan 1, 2007
90.407
-0.046
-0.05%
jan 1, 2008
91.064
+0.657
0.73%
jan 1, 2009
88.049
-3.015
-3.31%
jan 1, 2010
84.663
-3.386
-3.85%
jan 1, 2011
78.811
-5.852
-6.91%
jan 1, 2012
82.512
+3.7
4.69%
jan 1, 2013
80.367
-2.144
-2.6%
jan 1, 2014
79.811
-0.557
-0.69%
jan 1, 2015
81.305
+1.494
1.87%
Ranking of countries by current statistics by years


Comments: