29
/
en
AIzaSyAYiBZKx7MnpbEhh9jyipgxe19OcubqV5w
April 1, 2024
131545
Faroe Islands
FRO
true
2
1
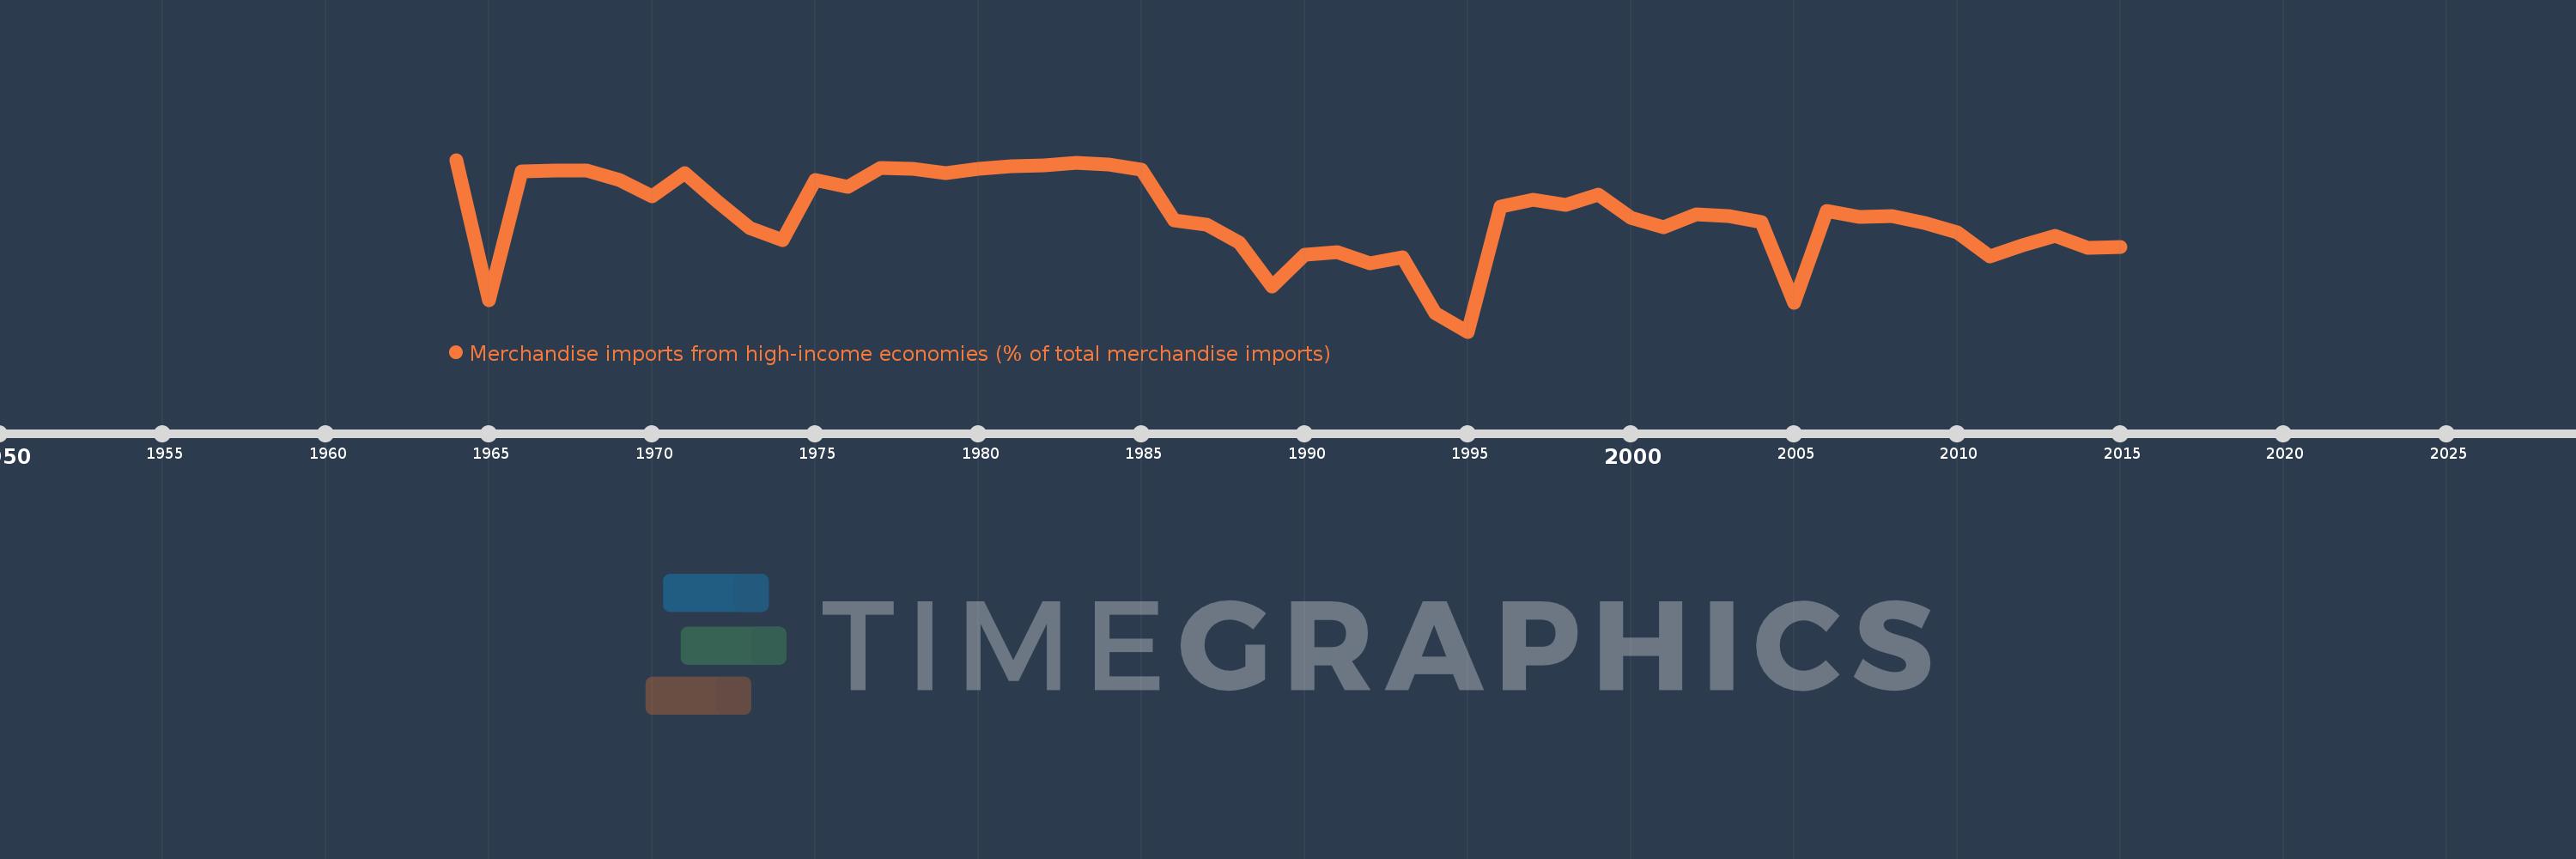
Merchandise imports from high-income economies (% of total merchandise imports)
2015,2014,2013,2012,2011,2010,2009,2008,2007,2006,2005,2004,2003,2002,2001,2000,1999,1998,1997,1996,1995,1994,1993,1992,1991,1990,1989,1988,1987,1986,1985,1984,1983,1982,1981,1980,1979,1978,1977,1976,1975,1974,1973,1972,1971,1970,1969,1968,1967,1966,1965,1964
This statistics in other country:
AfghanistanAlbaniaAlgeriaAngolaAntigua and BarbudaArab WorldArgentinaArmeniaArubaAustraliaAustriaAzerbaijanBahamas, TheBahrainBangladeshBarbadosBelarusBelgiumBelizeBeninBermudaBoliviaBosnia and HerzegovinaBrazilBrunei DarussalamBulgariaBurkina FasoBurundiCabo VerdeCambodiaCameroonCanadaCaribbean small statesCentral African RepublicCentral Europe and the BalticsChadChileChinaColombiaComorosCongo, Dem. Rep.Congo, Rep.Costa RicaCote d'IvoireCroatiaCubaCyprusCzech RepublicDenmarkDjiboutiDominicaDominican RepublicEarly-demographic dividendEast Asia & PacificEast Asia & Pacific (excluding high income)East Asia & Pacific (IDA & IBRD countries)EcuadorEgypt, Arab Rep.El SalvadorEquatorial GuineaEstoniaEthiopiaEuro areaEurope & Central AsiaEurope & Central Asia (excluding high income)Europe & Central Asia (IDA & IBRD countries)European UnionFaroe IslandsFijiFinlandFragile and conflict affected situationsFranceFrench PolynesiaGabonGambia, TheGeorgiaGermanyGhanaGibraltarGreeceGreenlandGrenadaGuamGuatemalaGuineaGuinea-BissauGuyanaHaitiHeavily indebted poor countries (HIPC)High incomeHondurasHong Kong SAR, ChinaHungaryIBRD onlyIcelandIDA & IBRD totalIDA blendIDA onlyIDA totalIndiaIndonesiaIran, Islamic Rep.IraqIrelandIsraelItalyJamaicaJapanJordanKazakhstanKenyaKiribatiKorea, Dem. People’s Rep.Korea, Rep.KosovoKuwaitKyrgyz RepublicLao PDRLate-demographic dividendLatin America & Caribbean Latin America & Caribbean (excluding high income)Latin America & the Caribbean (IDA & IBRD countries)LatviaLeast developed countries: UN classificationLebanonLiberiaLibyaLithuaniaLow & middle incomeLow incomeLower middle incomeLuxembourgMacao SAR, ChinaMacedonia, FYRMadagascarMalawiMalaysiaMaldivesMaliMaltaMauritaniaMauritiusMexicoMiddle East & North AfricaMiddle East & North Africa (excluding high income)Middle East & North Africa (IDA & IBRD countries)Middle incomeMoldovaMongoliaMontenegroMoroccoMozambiqueMyanmarNauruNepalNetherlandsNew CaledoniaNew ZealandNicaraguaNigerNigeriaNorth AmericaNorwayOECD membersOmanOther small statesPacific island small statesPakistanPanamaPapua New GuineaParaguayPeruPhilippinesPolandPortugalPost-demographic dividendPre-demographic dividendQatarRomaniaRussian FederationRwandaSamoaSao Tome and PrincipeSaudi ArabiaSenegalSerbiaSeychellesSierra LeoneSingaporeSlovak RepublicSloveniaSmall statesSolomon IslandsSomaliaSouth AfricaSouth AsiaSouth Asia (IDA & IBRD)SpainSri LankaSt. Kitts and NevisSt. LuciaSt. Vincent and the GrenadinesSub-Saharan Africa Sub-Saharan Africa (excluding high income)Sub-Saharan Africa (IDA & IBRD countries)SudanSurinameSwedenSwitzerlandSyrian Arab RepublicTajikistanTanzaniaThailandTogoTongaTrinidad and TobagoTunisiaTurkeyTurkmenistanTuvaluUgandaUkraineUnited Arab EmiratesUnited KingdomUnited StatesUpper middle incomeUruguayUzbekistanVanuatuVenezuela, RBVietnamWorldYemen, Rep.ZambiaZimbabwe Timeline:
This timeline shows a graph from 1964 to 2015 of Faroe Islands. No data until 1963. Number of actual observations by date: 52.
Source name:
World Development Indicators
Source organization:
World Bank staff estimates based data from International Monetary Fund's Direction of Trade database.
Categories, topics:
Private Sector, Trade
Last updated:
apr 23, 2017
Indicators value changes by year
Minimum:
94.179
jan 1, 1995
At the date of observation
Value
Absolute change
Change from previous value
jan 1, 1964
100.0
+100.0
0.0%
jan 1, 1965
95.238
-4.762
-4.76%
jan 1, 1966
99.618
+4.38
4.6%
jan 1, 1967
99.645
+0.027
0.03%
jan 1, 1968
99.624
-0.021
-0.02%
jan 1, 1969
99.321
-0.303
-0.3%
jan 1, 1970
98.772
-0.549
-0.55%
jan 1, 1971
99.557
+0.785
0.79%
jan 1, 1972
98.592
-0.964
-0.97%
jan 1, 1973
97.699
-0.894
-0.91%
jan 1, 1974
97.28
-0.419
-0.43%
jan 1, 1975
99.329
+2.049
2.11%
jan 1, 1976
99.095
-0.234
-0.24%
jan 1, 1977
99.724
+0.629
0.64%
jan 1, 1978
99.697
-0.027
-0.03%
jan 1, 1979
99.547
-0.15
-0.15%
jan 1, 1980
99.695
+0.148
0.15%
jan 1, 1981
99.795
+0.1
0.1%
jan 1, 1982
99.823
+0.028
0.03%
jan 1, 1983
99.893
+0.069
0.07%
jan 1, 1984
99.845
-0.047
-0.05%
jan 1, 1985
99.654
-0.191
-0.19%
jan 1, 1986
97.947
-1.708
-1.71%
jan 1, 1987
97.795
-0.151
-0.15%
jan 1, 1988
97.205
-0.59
-0.6%
jan 1, 1989
95.703
-1.502
-1.55%
jan 1, 1990
96.787
+1.084
1.13%
jan 1, 1991
96.884
+0.097
0.1%
jan 1, 1992
96.492
-0.392
-0.4%
jan 1, 1993
96.686
+0.194
0.2%
jan 1, 1994
94.794
-1.891
-1.96%
jan 1, 1995
94.179
-0.616
-0.65%
jan 1, 1996
98.423
+4.245
4.51%
jan 1, 1997
98.64
+0.216
0.22%
jan 1, 1998
98.458
-0.182
-0.18%
jan 1, 1999
98.834
+0.376
0.38%
jan 1, 2000
98.035
-0.799
-0.81%
jan 1, 2001
97.716
-0.319
-0.33%
jan 1, 2002
98.162
+0.446
0.46%
jan 1, 2003
98.097
-0.066
-0.07%
jan 1, 2004
97.894
-0.203
-0.21%
jan 1, 2005
95.149
-2.745
-2.8%
jan 1, 2006
98.266
+3.117
3.28%
jan 1, 2007
98.07
-0.196
-0.2%
jan 1, 2008
98.087
+0.018
0.02%
jan 1, 2009
97.847
-0.241
-0.25%
jan 1, 2010
97.533
-0.314
-0.32%
jan 1, 2011
96.724
-0.809
-0.83%
jan 1, 2012
97.09
+0.366
0.38%
jan 1, 2013
97.419
+0.329
0.34%
jan 1, 2014
97.028
-0.391
-0.4%
jan 1, 2015
97.049
+0.021
0.02%
Ranking of countries by current statistics by years


Comments: