29
/
en
AIzaSyAYiBZKx7MnpbEhh9jyipgxe19OcubqV5w
April 1, 2024
208841
New Caledonia
NCL
true
2
1
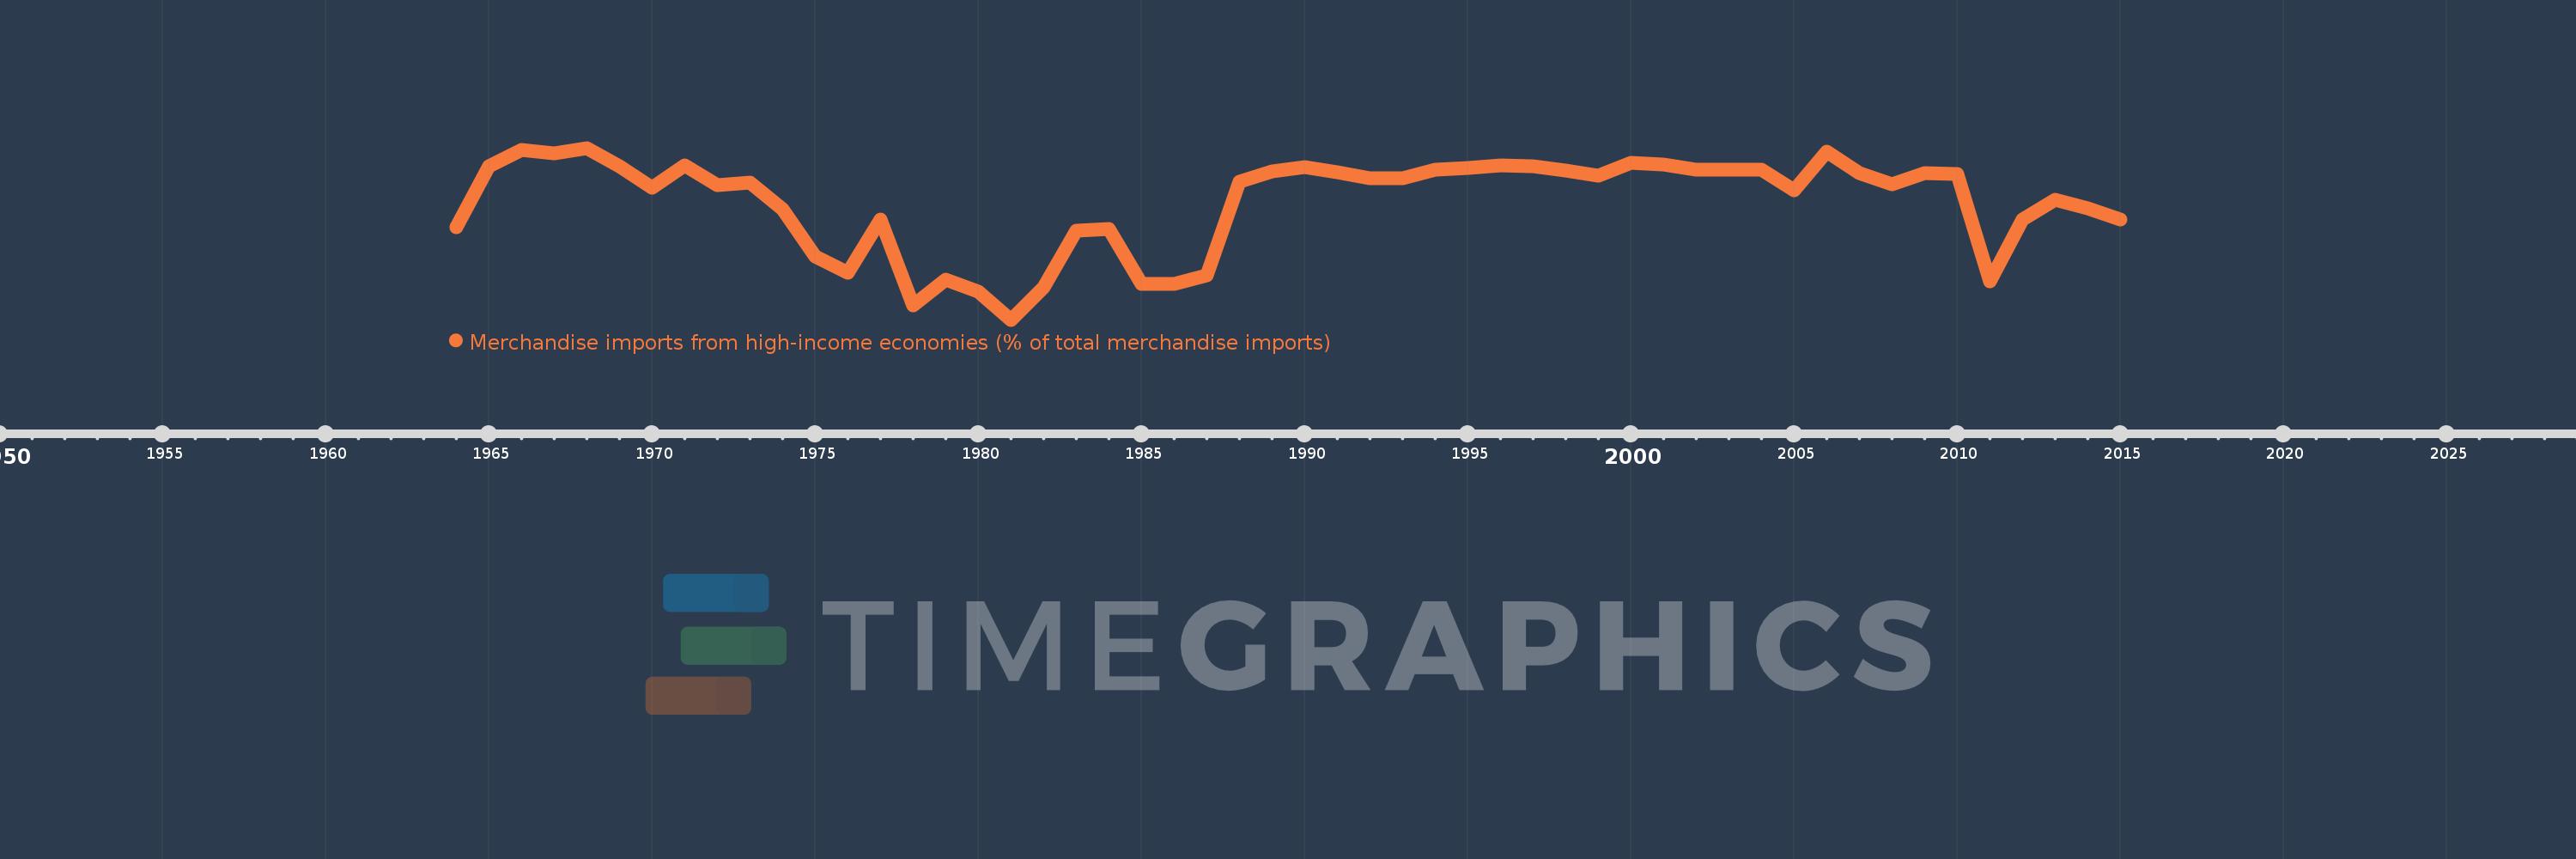
Merchandise imports from high-income economies (% of total merchandise imports)
2015,2014,2013,2012,2011,2010,2009,2008,2007,2006,2005,2004,2003,2002,2001,2000,1999,1998,1997,1996,1995,1994,1993,1992,1991,1990,1989,1988,1987,1986,1985,1984,1983,1982,1981,1980,1979,1978,1977,1976,1975,1974,1973,1972,1971,1970,1969,1968,1967,1966,1965,1964
This statistics in other country:
AfghanistanAlbaniaAlgeriaAngolaAntigua and BarbudaArab WorldArgentinaArmeniaArubaAustraliaAustriaAzerbaijanBahamas, TheBahrainBangladeshBarbadosBelarusBelgiumBelizeBeninBermudaBoliviaBosnia and HerzegovinaBrazilBrunei DarussalamBulgariaBurkina FasoBurundiCabo VerdeCambodiaCameroonCanadaCaribbean small statesCentral African RepublicCentral Europe and the BalticsChadChileChinaColombiaComorosCongo, Dem. Rep.Congo, Rep.Costa RicaCote d'IvoireCroatiaCubaCyprusCzech RepublicDenmarkDjiboutiDominicaDominican RepublicEarly-demographic dividendEast Asia & PacificEast Asia & Pacific (excluding high income)East Asia & Pacific (IDA & IBRD countries)EcuadorEgypt, Arab Rep.El SalvadorEquatorial GuineaEstoniaEthiopiaEuro areaEurope & Central AsiaEurope & Central Asia (excluding high income)Europe & Central Asia (IDA & IBRD countries)European UnionFaroe IslandsFijiFinlandFragile and conflict affected situationsFranceFrench PolynesiaGabonGambia, TheGeorgiaGermanyGhanaGibraltarGreeceGreenlandGrenadaGuamGuatemalaGuineaGuinea-BissauGuyanaHaitiHeavily indebted poor countries (HIPC)High incomeHondurasHong Kong SAR, ChinaHungaryIBRD onlyIcelandIDA & IBRD totalIDA blendIDA onlyIDA totalIndiaIndonesiaIran, Islamic Rep.IraqIrelandIsraelItalyJamaicaJapanJordanKazakhstanKenyaKiribatiKorea, Dem. People’s Rep.Korea, Rep.KosovoKuwaitKyrgyz RepublicLao PDRLate-demographic dividendLatin America & Caribbean Latin America & Caribbean (excluding high income)Latin America & the Caribbean (IDA & IBRD countries)LatviaLeast developed countries: UN classificationLebanonLiberiaLibyaLithuaniaLow & middle incomeLow incomeLower middle incomeLuxembourgMacao SAR, ChinaMacedonia, FYRMadagascarMalawiMalaysiaMaldivesMaliMaltaMauritaniaMauritiusMexicoMiddle East & North AfricaMiddle East & North Africa (excluding high income)Middle East & North Africa (IDA & IBRD countries)Middle incomeMoldovaMongoliaMontenegroMoroccoMozambiqueMyanmarNauruNepalNetherlandsNew CaledoniaNew ZealandNicaraguaNigerNigeriaNorth AmericaNorwayOECD membersOmanOther small statesPacific island small statesPakistanPanamaPapua New GuineaParaguayPeruPhilippinesPolandPortugalPost-demographic dividendPre-demographic dividendQatarRomaniaRussian FederationRwandaSamoaSao Tome and PrincipeSaudi ArabiaSenegalSerbiaSeychellesSierra LeoneSingaporeSlovak RepublicSloveniaSmall statesSolomon IslandsSomaliaSouth AfricaSouth AsiaSouth Asia (IDA & IBRD)SpainSri LankaSt. Kitts and NevisSt. LuciaSt. Vincent and the GrenadinesSub-Saharan Africa Sub-Saharan Africa (excluding high income)Sub-Saharan Africa (IDA & IBRD countries)SudanSurinameSwedenSwitzerlandSyrian Arab RepublicTajikistanTanzaniaThailandTogoTongaTrinidad and TobagoTunisiaTurkeyTurkmenistanTuvaluUgandaUkraineUnited Arab EmiratesUnited KingdomUnited StatesUpper middle incomeUruguayUzbekistanVanuatuVenezuela, RBVietnamWorldYemen, Rep.ZambiaZimbabwe Timeline:
This timeline shows a graph from 1964 to 2015 of New Caledonia. No data until 1963. Number of actual observations by date: 52.
Source name:
World Development Indicators
Source organization:
World Bank staff estimates based data from International Monetary Fund's Direction of Trade database.
Categories, topics:
Private Sector, Trade
Last updated:
apr 23, 2017
Indicators value changes by year
Minimum:
75.051
jan 1, 1981
Maximum:
94.804
jan 1, 1968
At the date of observation
Value
Absolute change
Change from previous value
jan 1, 1964
85.714
+85.714
0.0%
jan 1, 1965
92.661
+6.946
8.1%
jan 1, 1966
94.598
+1.938
2.09%
jan 1, 1967
94.196
-0.402
-0.42%
jan 1, 1968
94.804
+0.607
0.64%
jan 1, 1969
92.721
-2.083
-2.2%
jan 1, 1970
90.201
-2.52
-2.72%
jan 1, 1971
92.777
+2.576
2.86%
jan 1, 1972
90.508
-2.269
-2.45%
jan 1, 1973
90.825
+0.317
0.35%
jan 1, 1974
87.755
-3.071
-3.38%
jan 1, 1975
82.295
-5.46
-6.22%
jan 1, 1976
80.422
-1.873
-2.28%
jan 1, 1977
86.617
+6.195
7.7%
jan 1, 1978
76.737
-9.879
-11.41%
jan 1, 1979
79.685
+2.947
3.84%
jan 1, 1980
78.255
-1.43
-1.79%
jan 1, 1981
75.051
-3.204
-4.09%
jan 1, 1982
78.745
+3.695
4.92%
jan 1, 1983
85.262
+6.517
8.28%
jan 1, 1984
85.486
+0.224
0.26%
jan 1, 1985
79.186
-6.3
-7.37%
jan 1, 1986
79.188
+0.003
0.0%
jan 1, 1987
80.174
+0.986
1.25%
jan 1, 1988
90.908
+10.734
13.39%
jan 1, 1989
92.114
+1.206
1.33%
jan 1, 1990
92.57
+0.456
0.49%
jan 1, 1991
91.986
-0.584
-0.63%
jan 1, 1992
91.329
-0.657
-0.71%
jan 1, 1993
91.346
+0.017
0.02%
jan 1, 1994
92.332
+0.986
1.08%
jan 1, 1995
92.525
+0.193
0.21%
jan 1, 1996
92.845
+0.32
0.35%
jan 1, 1997
92.659
-0.187
-0.2%
jan 1, 1998
92.207
-0.451
-0.49%
jan 1, 1999
91.565
-0.642
-0.7%
jan 1, 2000
93.137
+1.572
1.72%
jan 1, 2001
92.862
-0.275
-0.3%
jan 1, 2002
92.26
-0.602
-0.65%
jan 1, 2003
92.29
+0.03
0.03%
jan 1, 2004
92.337
+0.047
0.05%
jan 1, 2005
89.903
-2.434
-2.64%
jan 1, 2006
94.383
+4.48
4.98%
jan 1, 2007
91.906
-2.477
-2.62%
jan 1, 2008
90.653
-1.252
-1.36%
jan 1, 2009
91.885
+1.231
1.36%
jan 1, 2010
91.838
-0.047
-0.05%
jan 1, 2011
79.462
-12.376
-13.48%
jan 1, 2012
86.542
+7.079
8.91%
jan 1, 2013
88.896
+2.354
2.72%
jan 1, 2014
87.893
-1.003
-1.13%
jan 1, 2015
86.6
-1.292
-1.47%
Ranking of countries by current statistics by years


Comments: