29
/
en
AIzaSyAYiBZKx7MnpbEhh9jyipgxe19OcubqV5w
April 1, 2024
244755
Somalia
SOM
true
2
1
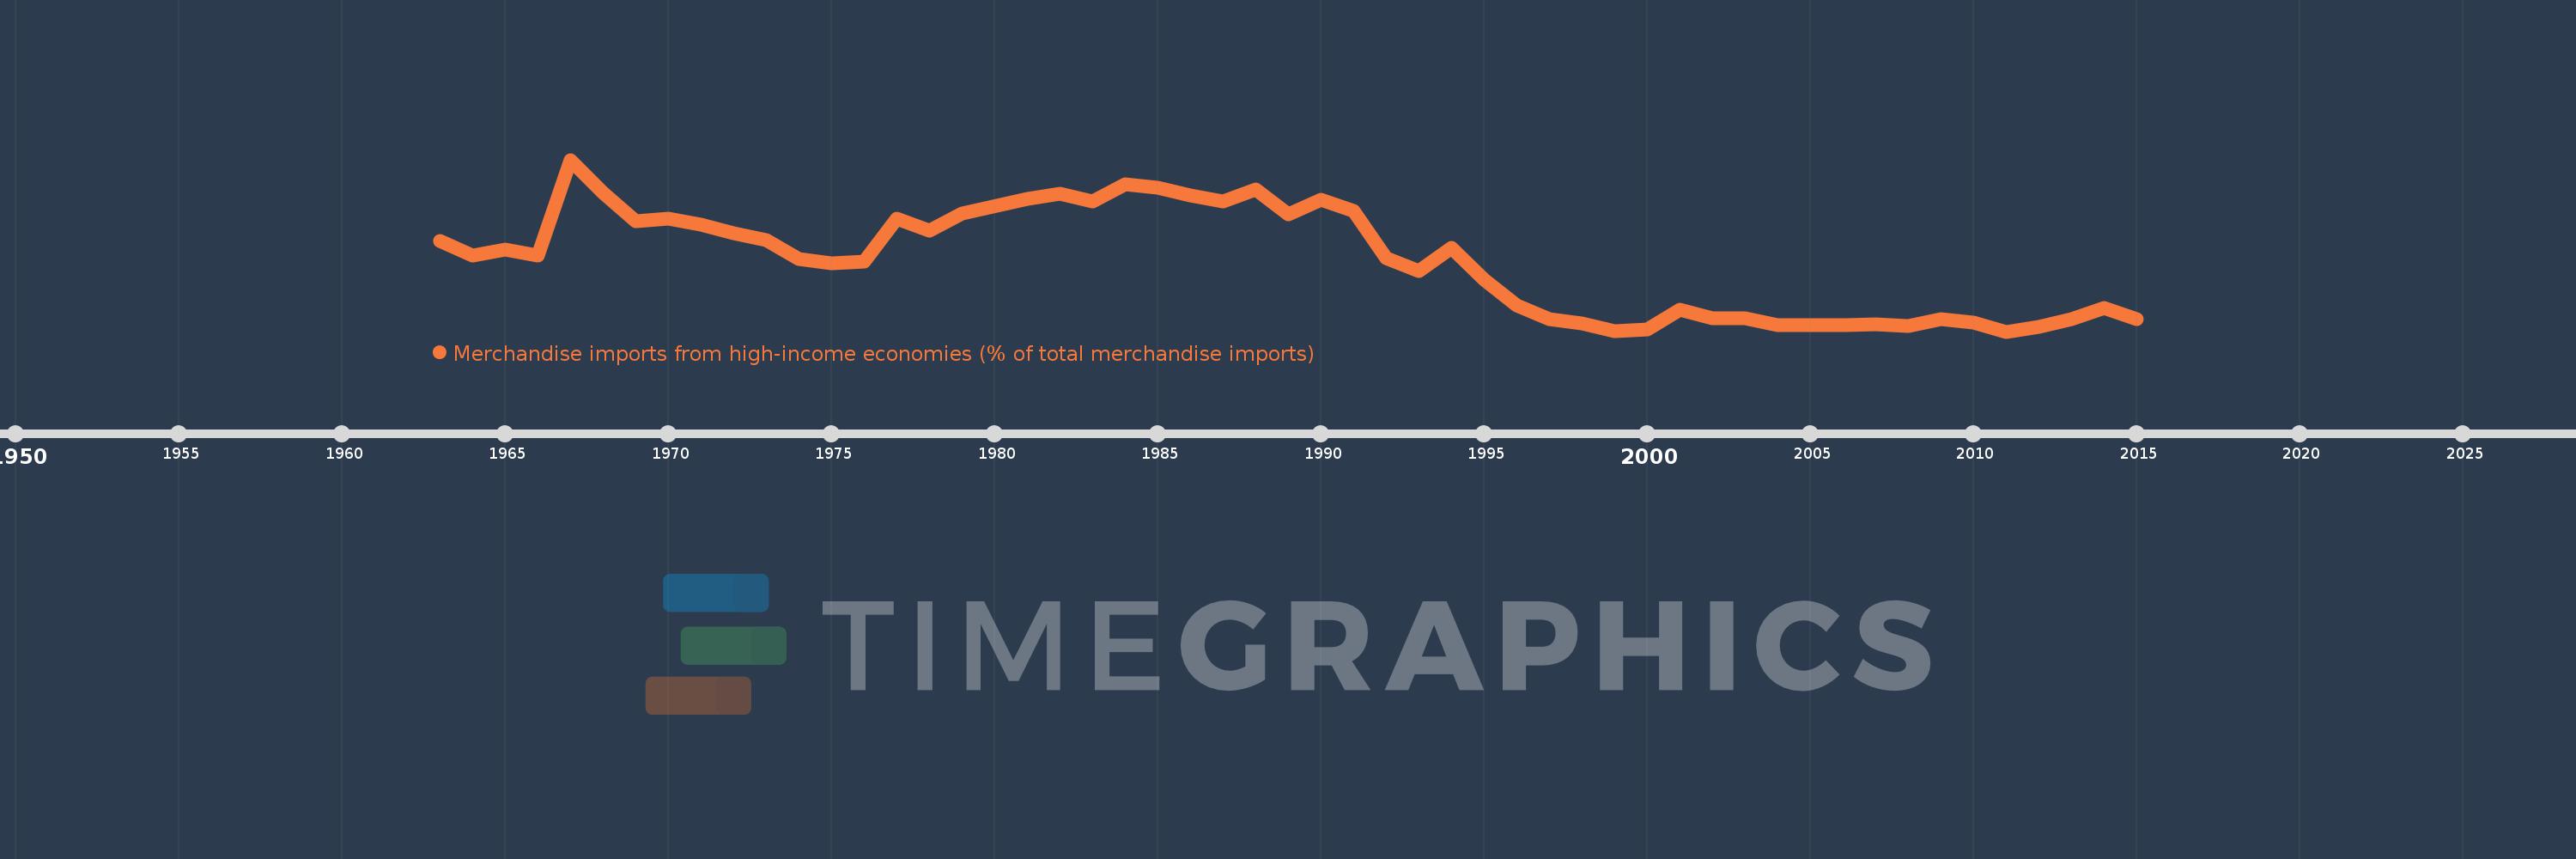
Merchandise imports from high-income economies (% of total merchandise imports)
2015,2014,2013,2012,2011,2010,2009,2008,2007,2006,2005,2004,2003,2002,2001,2000,1999,1998,1997,1996,1995,1994,1993,1992,1991,1990,1989,1988,1987,1986,1985,1984,1983,1982,1981,1979,1978,1977,1976,1975,1974,1973,1972,1971,1970,1969,1968,1967,1966,1965,1964,1963
This statistics in other country:
AfghanistanAlbaniaAlgeriaAngolaAntigua and BarbudaArab WorldArgentinaArmeniaArubaAustraliaAustriaAzerbaijanBahamas, TheBahrainBangladeshBarbadosBelarusBelgiumBelizeBeninBermudaBoliviaBosnia and HerzegovinaBrazilBrunei DarussalamBulgariaBurkina FasoBurundiCabo VerdeCambodiaCameroonCanadaCaribbean small statesCentral African RepublicCentral Europe and the BalticsChadChileChinaColombiaComorosCongo, Dem. Rep.Congo, Rep.Costa RicaCote d'IvoireCroatiaCubaCyprusCzech RepublicDenmarkDjiboutiDominicaDominican RepublicEarly-demographic dividendEast Asia & PacificEast Asia & Pacific (excluding high income)East Asia & Pacific (IDA & IBRD countries)EcuadorEgypt, Arab Rep.El SalvadorEquatorial GuineaEstoniaEthiopiaEuro areaEurope & Central AsiaEurope & Central Asia (excluding high income)Europe & Central Asia (IDA & IBRD countries)European UnionFaroe IslandsFijiFinlandFragile and conflict affected situationsFranceFrench PolynesiaGabonGambia, TheGeorgiaGermanyGhanaGibraltarGreeceGreenlandGrenadaGuamGuatemalaGuineaGuinea-BissauGuyanaHaitiHeavily indebted poor countries (HIPC)High incomeHondurasHong Kong SAR, ChinaHungaryIBRD onlyIcelandIDA & IBRD totalIDA blendIDA onlyIDA totalIndiaIndonesiaIran, Islamic Rep.IraqIrelandIsraelItalyJamaicaJapanJordanKazakhstanKenyaKiribatiKorea, Dem. People’s Rep.Korea, Rep.KosovoKuwaitKyrgyz RepublicLao PDRLate-demographic dividendLatin America & Caribbean Latin America & Caribbean (excluding high income)Latin America & the Caribbean (IDA & IBRD countries)LatviaLeast developed countries: UN classificationLebanonLiberiaLibyaLithuaniaLow & middle incomeLow incomeLower middle incomeLuxembourgMacao SAR, ChinaMacedonia, FYRMadagascarMalawiMalaysiaMaldivesMaliMaltaMauritaniaMauritiusMexicoMiddle East & North AfricaMiddle East & North Africa (excluding high income)Middle East & North Africa (IDA & IBRD countries)Middle incomeMoldovaMongoliaMontenegroMoroccoMozambiqueMyanmarNauruNepalNetherlandsNew CaledoniaNew ZealandNicaraguaNigerNigeriaNorth AmericaNorwayOECD membersOmanOther small statesPacific island small statesPakistanPanamaPapua New GuineaParaguayPeruPhilippinesPolandPortugalPost-demographic dividendPre-demographic dividendQatarRomaniaRussian FederationRwandaSamoaSao Tome and PrincipeSaudi ArabiaSenegalSerbiaSeychellesSierra LeoneSingaporeSlovak RepublicSloveniaSmall statesSolomon IslandsSomaliaSouth AfricaSouth AsiaSouth Asia (IDA & IBRD)SpainSri LankaSt. Kitts and NevisSt. LuciaSt. Vincent and the GrenadinesSub-Saharan Africa Sub-Saharan Africa (excluding high income)Sub-Saharan Africa (IDA & IBRD countries)SudanSurinameSwedenSwitzerlandSyrian Arab RepublicTajikistanTanzaniaThailandTogoTongaTrinidad and TobagoTunisiaTurkeyTurkmenistanTuvaluUgandaUkraineUnited Arab EmiratesUnited KingdomUnited StatesUpper middle incomeUruguayUzbekistanVanuatuVenezuela, RBVietnamWorldYemen, Rep.ZambiaZimbabwe Timeline:
This timeline shows a graph from 1963 to 2015 of Somalia. No data until 1962. Number of actual observations by date: 52.
Source name:
World Development Indicators
Source organization:
World Bank staff estimates based data from International Monetary Fund's Direction of Trade database.
Categories, topics:
Private Sector, Trade
Last updated:
apr 23, 2017
Indicators value changes by year
Minimum:
13.929
jan 1, 2011
Maximum:
99.624
jan 1, 1967
At the date of observation
Value
Absolute change
Change from previous value
jan 1, 1963
58.995
+58.995
0.0%
jan 1, 1964
51.794
-7.201
-12.21%
jan 1, 1965
54.731
+2.937
5.67%
jan 1, 1966
51.724
-3.007
-5.49%
jan 1, 1967
99.624
+47.9
92.61%
jan 1, 1968
83.333
-16.291
-16.35%
jan 1, 1969
68.97
-14.363
-17.24%
jan 1, 1970
70.079
+1.109
1.61%
jan 1, 1971
67.452
-2.628
-3.75%
jan 1, 1972
63.064
-4.388
-6.51%
jan 1, 1973
59.764
-3.3
-5.23%
jan 1, 1974
49.957
-9.806
-16.41%
jan 1, 1975
47.991
-1.966
-3.94%
jan 1, 1976
48.68
+0.689
1.44%
jan 1, 1977
70.445
+21.765
44.71%
jan 1, 1978
64.358
-6.087
-8.64%
jan 1, 1979
72.941
+8.583
13.34%
jan 1, 1981
80.227
+7.286
9.99%
jan 1, 1982
82.783
+2.556
3.19%
jan 1, 1983
78.822
-3.961
-4.78%
jan 1, 1984
87.289
+8.467
10.74%
jan 1, 1985
85.757
-1.532
-1.76%
jan 1, 1986
82.036
-3.721
-4.34%
jan 1, 1987
78.73
-3.305
-4.03%
jan 1, 1988
84.991
+6.261
7.95%
jan 1, 1989
72.239
-12.752
-15.0%
jan 1, 1990
79.651
+7.412
10.26%
jan 1, 1991
74.201
-5.45
-6.84%
jan 1, 1992
50.709
-23.491
-31.66%
jan 1, 1993
44.106
-6.603
-13.02%
jan 1, 1994
55.769
+11.663
26.44%
jan 1, 1995
39.952
-15.817
-28.36%
jan 1, 1996
26.904
-13.049
-32.66%
jan 1, 1997
19.937
-6.967
-25.89%
jan 1, 1998
17.956
-1.981
-9.93%
jan 1, 1999
14.33
-3.627
-20.2%
jan 1, 2000
15.06
+0.731
5.1%
jan 1, 2001
24.979
+9.919
65.86%
jan 1, 2002
20.751
-4.228
-16.93%
jan 1, 2003
20.702
-0.049
-0.23%
jan 1, 2004
17.007
-3.695
-17.85%
jan 1, 2005
17.253
+0.246
1.44%
jan 1, 2006
17.068
-0.185
-1.07%
jan 1, 2007
17.736
+0.668
3.92%
jan 1, 2008
16.86
-0.876
-4.94%
jan 1, 2009
20.264
+3.404
20.19%
jan 1, 2010
18.439
-1.826
-9.01%
jan 1, 2011
13.929
-4.51
-24.46%
jan 1, 2012
16.405
+2.476
17.78%
jan 1, 2013
19.988
+3.583
21.84%
jan 1, 2014
25.623
+5.635
28.19%
jan 1, 2015
19.945
-5.678
-22.16%
Ranking of countries by current statistics by years


Comments: