29
/
en
AIzaSyAYiBZKx7MnpbEhh9jyipgxe19OcubqV5w
April 1, 2024
121170
Dominica
DMA
true
2
1
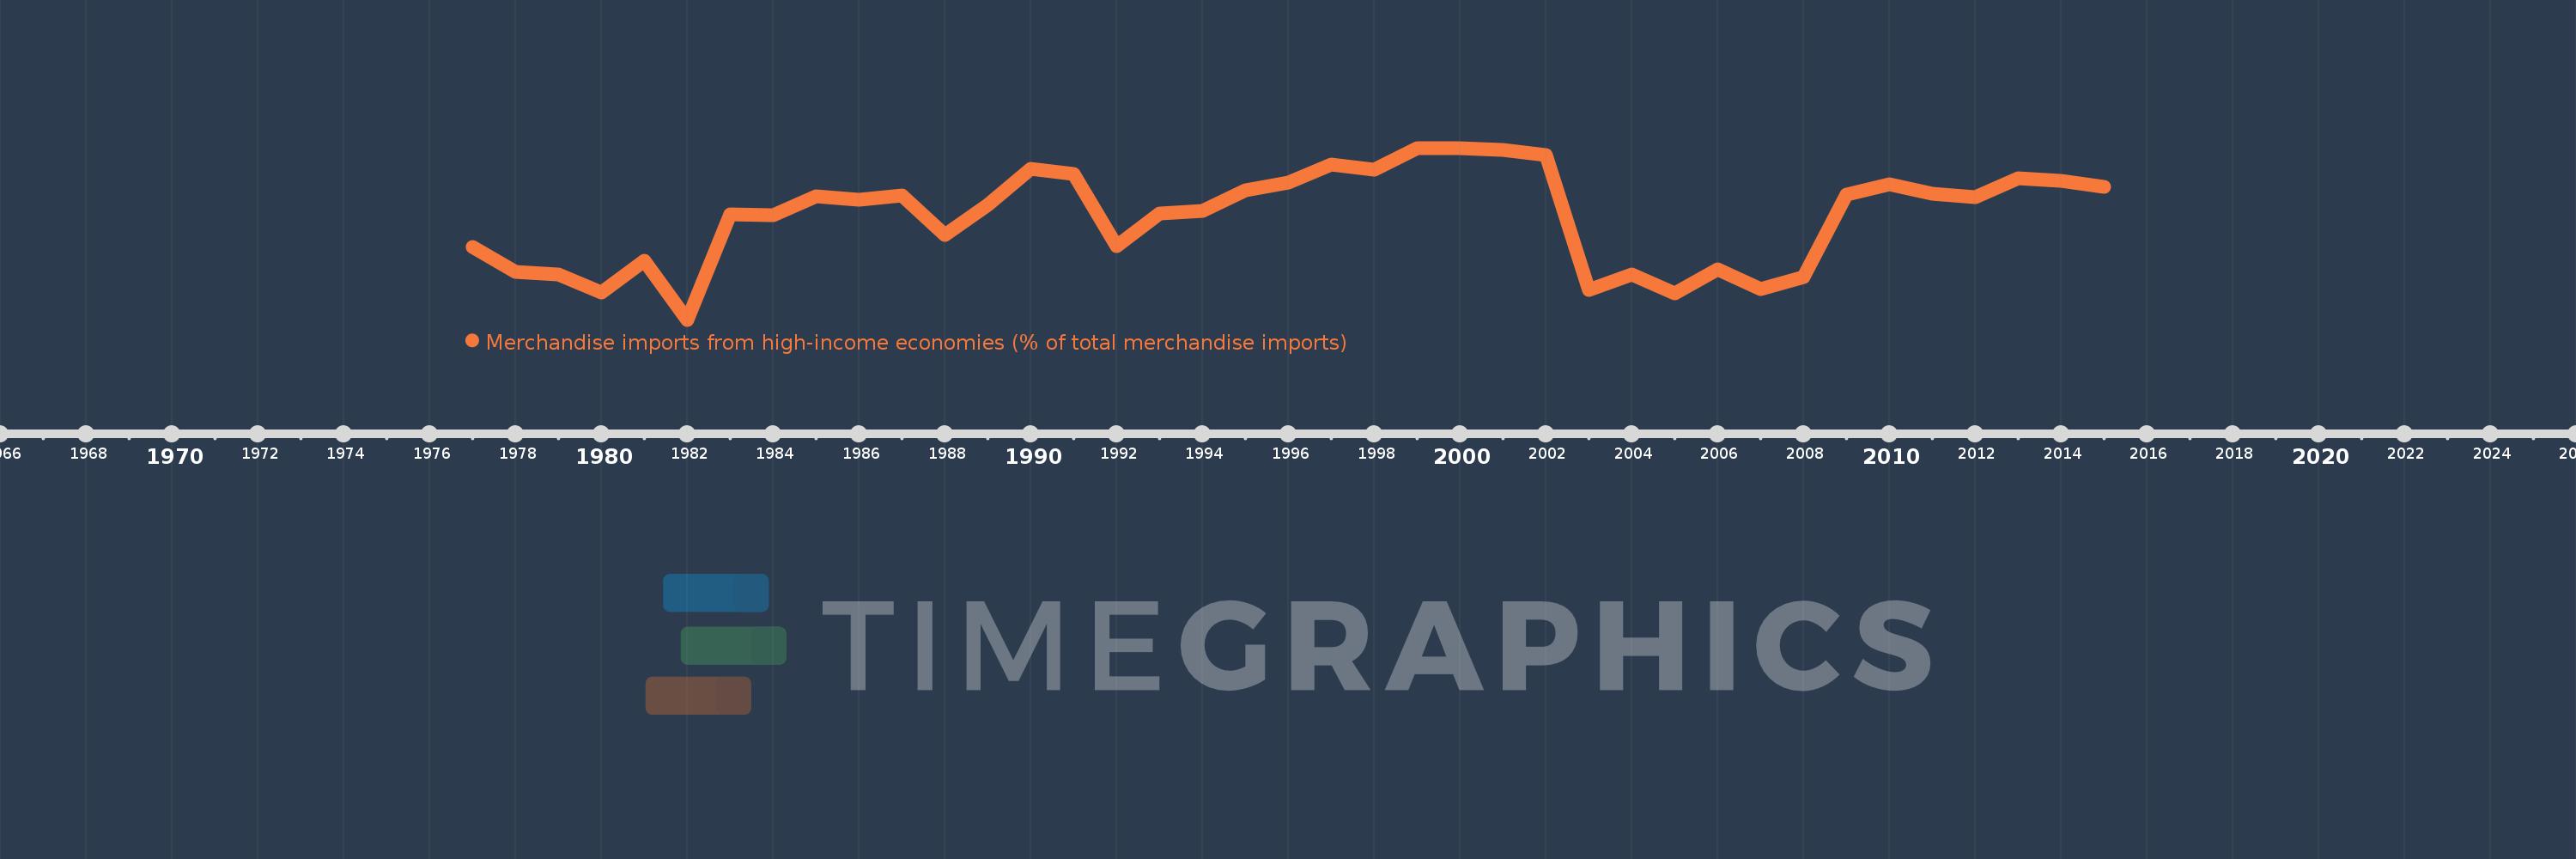
Merchandise imports from high-income economies (% of total merchandise imports)
2015,2014,2013,2012,2011,2010,2009,2008,2007,2006,2005,2004,2003,2002,2001,2000,1999,1998,1997,1996,1995,1994,1993,1992,1991,1990,1989,1988,1987,1986,1985,1984,1983,1982,1981,1980,1979,1978,1977
This statistics in other country:
AfghanistanAlbaniaAlgeriaAngolaAntigua and BarbudaArab WorldArgentinaArmeniaArubaAustraliaAustriaAzerbaijanBahamas, TheBahrainBangladeshBarbadosBelarusBelgiumBelizeBeninBermudaBoliviaBosnia and HerzegovinaBrazilBrunei DarussalamBulgariaBurkina FasoBurundiCabo VerdeCambodiaCameroonCanadaCaribbean small statesCentral African RepublicCentral Europe and the BalticsChadChileChinaColombiaComorosCongo, Dem. Rep.Congo, Rep.Costa RicaCote d'IvoireCroatiaCubaCyprusCzech RepublicDenmarkDjiboutiDominicaDominican RepublicEarly-demographic dividendEast Asia & PacificEast Asia & Pacific (excluding high income)East Asia & Pacific (IDA & IBRD countries)EcuadorEgypt, Arab Rep.El SalvadorEquatorial GuineaEstoniaEthiopiaEuro areaEurope & Central AsiaEurope & Central Asia (excluding high income)Europe & Central Asia (IDA & IBRD countries)European UnionFaroe IslandsFijiFinlandFragile and conflict affected situationsFranceFrench PolynesiaGabonGambia, TheGeorgiaGermanyGhanaGibraltarGreeceGreenlandGrenadaGuamGuatemalaGuineaGuinea-BissauGuyanaHaitiHeavily indebted poor countries (HIPC)High incomeHondurasHong Kong SAR, ChinaHungaryIBRD onlyIcelandIDA & IBRD totalIDA blendIDA onlyIDA totalIndiaIndonesiaIran, Islamic Rep.IraqIrelandIsraelItalyJamaicaJapanJordanKazakhstanKenyaKiribatiKorea, Dem. People’s Rep.Korea, Rep.KosovoKuwaitKyrgyz RepublicLao PDRLate-demographic dividendLatin America & Caribbean Latin America & Caribbean (excluding high income)Latin America & the Caribbean (IDA & IBRD countries)LatviaLeast developed countries: UN classificationLebanonLiberiaLibyaLithuaniaLow & middle incomeLow incomeLower middle incomeLuxembourgMacao SAR, ChinaMacedonia, FYRMadagascarMalawiMalaysiaMaldivesMaliMaltaMauritaniaMauritiusMexicoMiddle East & North AfricaMiddle East & North Africa (excluding high income)Middle East & North Africa (IDA & IBRD countries)Middle incomeMoldovaMongoliaMontenegroMoroccoMozambiqueMyanmarNauruNepalNetherlandsNew CaledoniaNew ZealandNicaraguaNigerNigeriaNorth AmericaNorwayOECD membersOmanOther small statesPacific island small statesPakistanPanamaPapua New GuineaParaguayPeruPhilippinesPolandPortugalPost-demographic dividendPre-demographic dividendQatarRomaniaRussian FederationRwandaSamoaSao Tome and PrincipeSaudi ArabiaSenegalSerbiaSeychellesSierra LeoneSingaporeSlovak RepublicSloveniaSmall statesSolomon IslandsSomaliaSouth AfricaSouth AsiaSouth Asia (IDA & IBRD)SpainSri LankaSt. Kitts and NevisSt. LuciaSt. Vincent and the GrenadinesSub-Saharan Africa Sub-Saharan Africa (excluding high income)Sub-Saharan Africa (IDA & IBRD countries)SudanSurinameSwedenSwitzerlandSyrian Arab RepublicTajikistanTanzaniaThailandTogoTongaTrinidad and TobagoTunisiaTurkeyTurkmenistanTuvaluUgandaUkraineUnited Arab EmiratesUnited KingdomUnited StatesUpper middle incomeUruguayUzbekistanVanuatuVenezuela, RBVietnamWorldYemen, Rep.ZambiaZimbabwe Timeline:
This timeline shows a graph from 1977 to 2015 of Dominica. No data until 1976. Number of actual observations by date: 39.
Source name:
World Development Indicators
Source organization:
World Bank staff estimates based data from International Monetary Fund's Direction of Trade database.
Categories, topics:
Private Sector, Trade
Last updated:
apr 23, 2017
Indicators value changes by year
Minimum:
59.643
jan 1, 1982
At the date of observation
Value
Absolute change
Change from previous value
jan 1, 1977
71.159
+71.159
0.0%
jan 1, 1978
67.293
-3.867
-5.43%
jan 1, 1979
66.846
-0.447
-0.66%
jan 1, 1980
63.904
-2.942
-4.4%
jan 1, 1981
68.99
+5.086
7.96%
jan 1, 1982
59.643
-9.347
-13.55%
jan 1, 1983
76.291
+16.648
27.91%
jan 1, 1984
76.28
-0.012
-0.02%
jan 1, 1985
79.161
+2.881
3.78%
jan 1, 1986
78.664
-0.497
-0.63%
jan 1, 1987
79.392
+0.728
0.93%
jan 1, 1988
73.142
-6.25
-7.87%
jan 1, 1989
77.793
+4.652
6.36%
jan 1, 1990
83.605
+5.811
7.47%
jan 1, 1991
82.784
-0.821
-0.98%
jan 1, 1992
71.333
-11.451
-13.83%
jan 1, 1993
76.421
+5.088
7.13%
jan 1, 1994
76.874
+0.453
0.59%
jan 1, 1995
80.12
+3.245
4.22%
jan 1, 1996
81.357
+1.238
1.54%
jan 1, 1997
84.186
+2.829
3.48%
jan 1, 1998
83.477
-0.709
-0.84%
jan 1, 1999
86.789
+3.312
3.97%
jan 1, 2000
86.88
+0.091
0.1%
jan 1, 2001
86.526
-0.354
-0.41%
jan 1, 2002
85.69
-0.836
-0.97%
jan 1, 2003
64.378
-21.312
-24.87%
jan 1, 2004
66.758
+2.38
3.7%
jan 1, 2005
63.832
-2.926
-4.38%
jan 1, 2006
67.68
+3.848
6.03%
jan 1, 2007
64.532
-3.148
-4.65%
jan 1, 2008
66.387
+1.855
2.87%
jan 1, 2009
79.521
+13.134
19.78%
jan 1, 2010
81.08
+1.56
1.96%
jan 1, 2011
79.614
-1.466
-1.81%
jan 1, 2012
79.116
-0.498
-0.63%
jan 1, 2013
82.071
+2.955
3.74%
jan 1, 2014
81.631
-0.441
-0.54%
jan 1, 2015
80.743
-0.888
-1.09%
Ranking of countries by current statistics by years


Comments: