29
/
en
AIzaSyAYiBZKx7MnpbEhh9jyipgxe19OcubqV5w
April 1, 2024
227649
Qatar
QAT
true
2
1
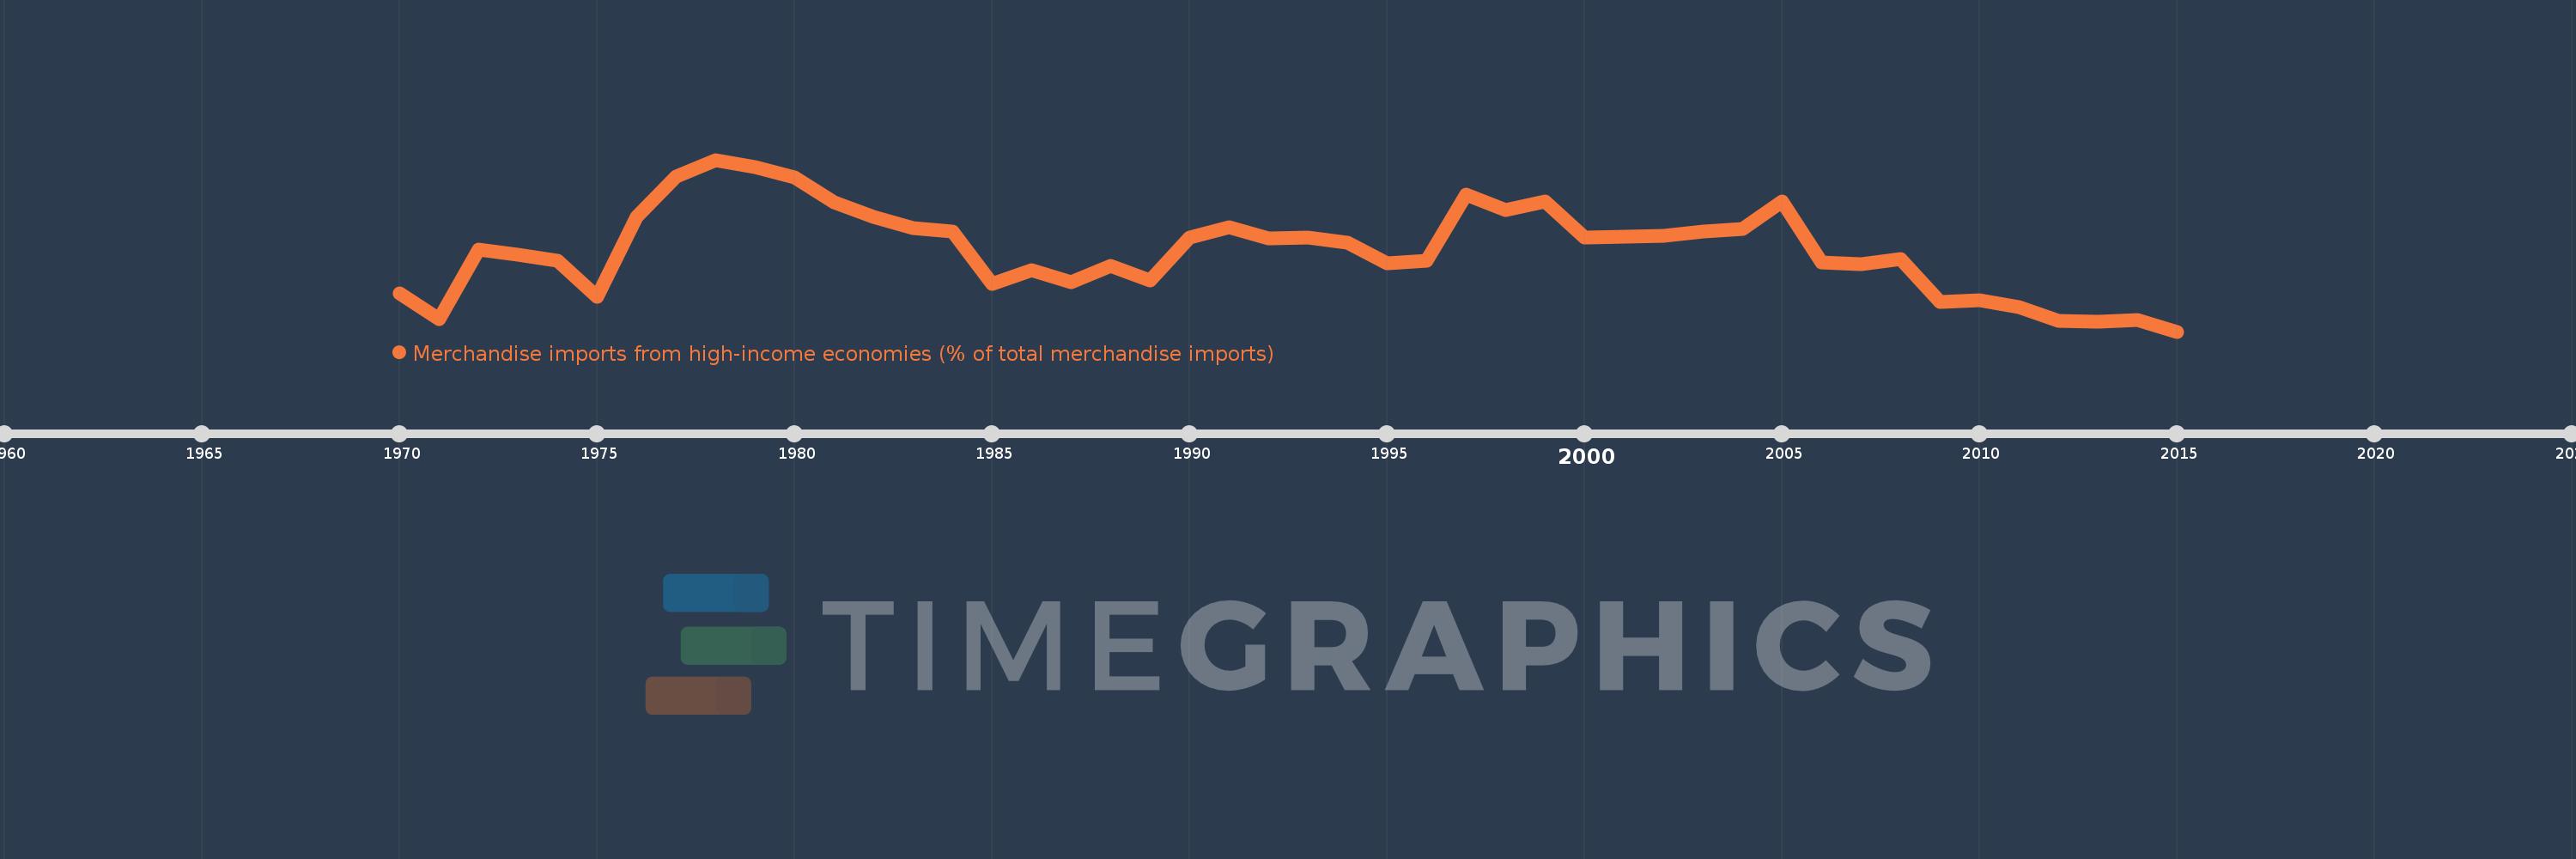
Merchandise imports from high-income economies (% of total merchandise imports)
2015,2014,2013,2012,2011,2010,2009,2008,2007,2006,2005,2004,2003,2002,2001,2000,1999,1998,1997,1996,1995,1994,1993,1992,1991,1990,1989,1988,1987,1986,1985,1984,1983,1982,1981,1980,1979,1978,1977,1976,1975,1974,1973,1972,1971,1970
This statistics in other country:
AfghanistanAlbaniaAlgeriaAngolaAntigua and BarbudaArab WorldArgentinaArmeniaArubaAustraliaAustriaAzerbaijanBahamas, TheBahrainBangladeshBarbadosBelarusBelgiumBelizeBeninBermudaBoliviaBosnia and HerzegovinaBrazilBrunei DarussalamBulgariaBurkina FasoBurundiCabo VerdeCambodiaCameroonCanadaCaribbean small statesCentral African RepublicCentral Europe and the BalticsChadChileChinaColombiaComorosCongo, Dem. Rep.Congo, Rep.Costa RicaCote d'IvoireCroatiaCubaCyprusCzech RepublicDenmarkDjiboutiDominicaDominican RepublicEarly-demographic dividendEast Asia & PacificEast Asia & Pacific (excluding high income)East Asia & Pacific (IDA & IBRD countries)EcuadorEgypt, Arab Rep.El SalvadorEquatorial GuineaEstoniaEthiopiaEuro areaEurope & Central AsiaEurope & Central Asia (excluding high income)Europe & Central Asia (IDA & IBRD countries)European UnionFaroe IslandsFijiFinlandFragile and conflict affected situationsFranceFrench PolynesiaGabonGambia, TheGeorgiaGermanyGhanaGibraltarGreeceGreenlandGrenadaGuamGuatemalaGuineaGuinea-BissauGuyanaHaitiHeavily indebted poor countries (HIPC)High incomeHondurasHong Kong SAR, ChinaHungaryIBRD onlyIcelandIDA & IBRD totalIDA blendIDA onlyIDA totalIndiaIndonesiaIran, Islamic Rep.IraqIrelandIsraelItalyJamaicaJapanJordanKazakhstanKenyaKiribatiKorea, Dem. People’s Rep.Korea, Rep.KosovoKuwaitKyrgyz RepublicLao PDRLate-demographic dividendLatin America & Caribbean Latin America & Caribbean (excluding high income)Latin America & the Caribbean (IDA & IBRD countries)LatviaLeast developed countries: UN classificationLebanonLiberiaLibyaLithuaniaLow & middle incomeLow incomeLower middle incomeLuxembourgMacao SAR, ChinaMacedonia, FYRMadagascarMalawiMalaysiaMaldivesMaliMaltaMauritaniaMauritiusMexicoMiddle East & North AfricaMiddle East & North Africa (excluding high income)Middle East & North Africa (IDA & IBRD countries)Middle incomeMoldovaMongoliaMontenegroMoroccoMozambiqueMyanmarNauruNepalNetherlandsNew CaledoniaNew ZealandNicaraguaNigerNigeriaNorth AmericaNorwayOECD membersOmanOther small statesPacific island small statesPakistanPanamaPapua New GuineaParaguayPeruPhilippinesPolandPortugalPost-demographic dividendPre-demographic dividendQatarRomaniaRussian FederationRwandaSamoaSao Tome and PrincipeSaudi ArabiaSenegalSerbiaSeychellesSierra LeoneSingaporeSlovak RepublicSloveniaSmall statesSolomon IslandsSomaliaSouth AfricaSouth AsiaSouth Asia (IDA & IBRD)SpainSri LankaSt. Kitts and NevisSt. LuciaSt. Vincent and the GrenadinesSub-Saharan Africa Sub-Saharan Africa (excluding high income)Sub-Saharan Africa (IDA & IBRD countries)SudanSurinameSwedenSwitzerlandSyrian Arab RepublicTajikistanTanzaniaThailandTogoTongaTrinidad and TobagoTunisiaTurkeyTurkmenistanTuvaluUgandaUkraineUnited Arab EmiratesUnited KingdomUnited StatesUpper middle incomeUruguayUzbekistanVanuatuVenezuela, RBVietnamWorldYemen, Rep.ZambiaZimbabwe Timeline:
This timeline shows a graph from 1970 to 2015 of Qatar. No data until 1969. Number of actual observations by date: 46.
Source name:
World Development Indicators
Source organization:
World Bank staff estimates based data from International Monetary Fund's Direction of Trade database.
Categories, topics:
Private Sector, Trade
Last updated:
apr 23, 2017
Indicators value changes by year
Minimum:
73.724
jan 1, 2015
Maximum:
92.113
jan 1, 1978
At the date of observation
Value
Absolute change
Change from previous value
jan 1, 1970
77.78
+77.78
0.0%
jan 1, 1971
75.063
-2.717
-3.49%
jan 1, 1972
82.473
+7.41
9.87%
jan 1, 1973
81.983
-0.49
-0.59%
jan 1, 1974
81.321
-0.662
-0.81%
jan 1, 1975
77.447
-3.873
-4.76%
jan 1, 1976
85.967
+8.52
11.0%
jan 1, 1977
90.302
+4.335
5.04%
jan 1, 1978
92.113
+1.811
2.01%
jan 1, 1979
91.333
-0.78
-0.85%
jan 1, 1980
90.197
-1.136
-1.24%
jan 1, 1981
87.533
-2.665
-2.95%
jan 1, 1982
86.026
-1.507
-1.72%
jan 1, 1983
84.784
-1.242
-1.44%
jan 1, 1984
84.452
-0.332
-0.39%
jan 1, 1985
78.833
-5.619
-6.65%
jan 1, 1986
80.276
+1.444
1.83%
jan 1, 1987
79.003
-1.274
-1.59%
jan 1, 1988
80.762
+1.76
2.23%
jan 1, 1989
79.223
-1.54
-1.91%
jan 1, 1990
83.788
+4.565
5.76%
jan 1, 1991
84.914
+1.126
1.34%
jan 1, 1992
83.663
-1.251
-1.47%
jan 1, 1993
83.766
+0.103
0.12%
jan 1, 1994
83.216
-0.55
-0.66%
jan 1, 1995
81.078
-2.138
-2.57%
jan 1, 1996
81.303
+0.225
0.28%
jan 1, 1997
88.368
+7.065
8.69%
jan 1, 1998
86.725
-1.642
-1.86%
jan 1, 1999
87.694
+0.969
1.12%
jan 1, 2000
83.781
-3.914
-4.46%
jan 1, 2001
83.928
+0.147
0.18%
jan 1, 2002
83.938
+0.01
0.01%
jan 1, 2003
84.399
+0.461
0.55%
jan 1, 2004
84.707
+0.308
0.36%
jan 1, 2005
87.664
+2.956
3.49%
jan 1, 2006
81.139
-6.524
-7.44%
jan 1, 2007
80.983
-0.156
-0.19%
jan 1, 2008
81.49
+0.506
0.63%
jan 1, 2009
76.862
-4.628
-5.68%
jan 1, 2010
77.048
+0.186
0.24%
jan 1, 2011
76.344
-0.704
-0.91%
jan 1, 2012
74.85
-1.494
-1.96%
jan 1, 2013
74.826
-0.025
-0.03%
jan 1, 2014
74.997
+0.171
0.23%
jan 1, 2015
73.724
-1.273
-1.7%
Ranking of countries by current statistics by years


Comments: