29
/
en
AIzaSyAYiBZKx7MnpbEhh9jyipgxe19OcubqV5w
April 1, 2024
183138
Macao SAR, China
MAC
true
2
1
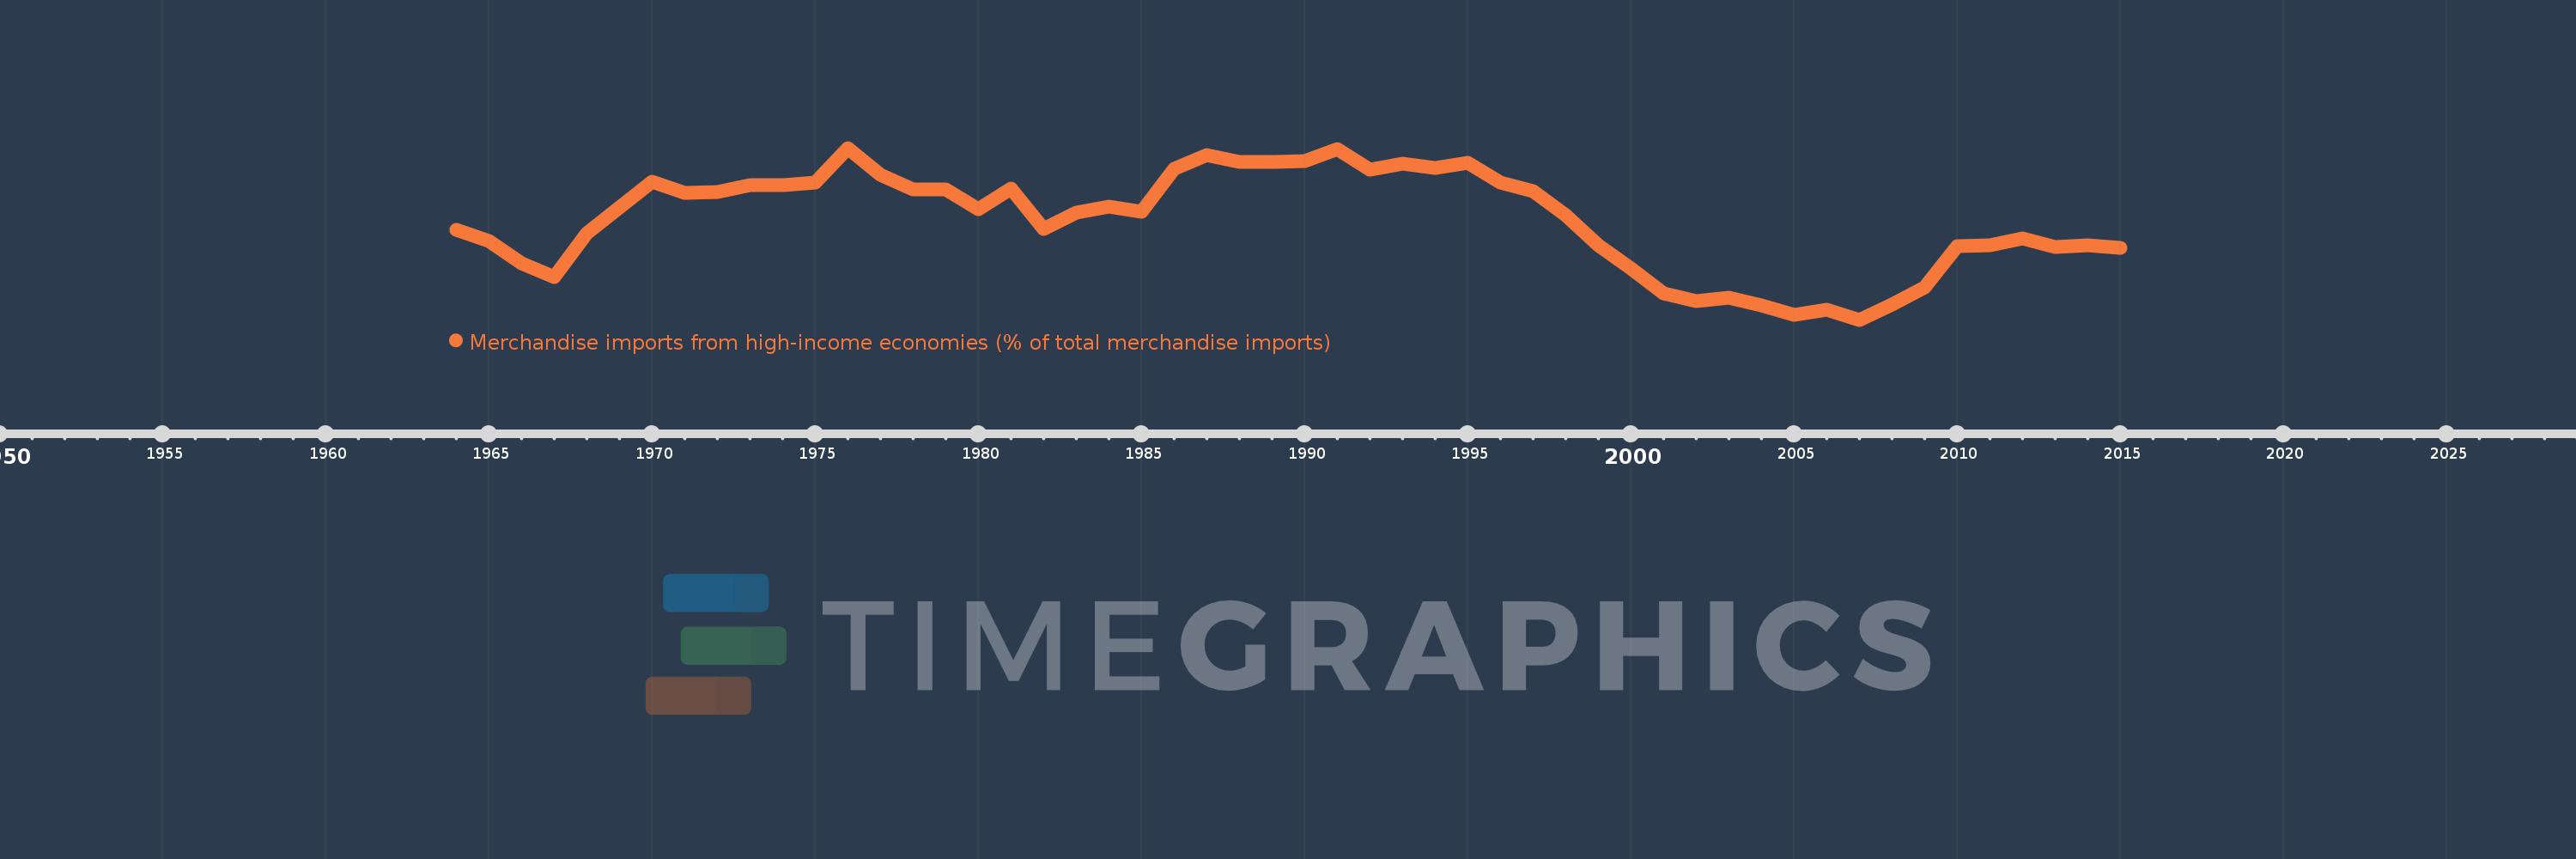
Merchandise imports from high-income economies (% of total merchandise imports)
2015,2014,2013,2012,2011,2010,2009,2008,2007,2006,2005,2004,2003,2002,2001,2000,1999,1998,1997,1996,1995,1994,1993,1992,1991,1990,1989,1988,1987,1986,1985,1984,1983,1982,1981,1980,1979,1978,1977,1976,1975,1974,1973,1972,1971,1970,1968,1967,1966,1965,1964
This statistics in other country:
AfghanistanAlbaniaAlgeriaAngolaAntigua and BarbudaArab WorldArgentinaArmeniaArubaAustraliaAustriaAzerbaijanBahamas, TheBahrainBangladeshBarbadosBelarusBelgiumBelizeBeninBermudaBoliviaBosnia and HerzegovinaBrazilBrunei DarussalamBulgariaBurkina FasoBurundiCabo VerdeCambodiaCameroonCanadaCaribbean small statesCentral African RepublicCentral Europe and the BalticsChadChileChinaColombiaComorosCongo, Dem. Rep.Congo, Rep.Costa RicaCote d'IvoireCroatiaCubaCyprusCzech RepublicDenmarkDjiboutiDominicaDominican RepublicEarly-demographic dividendEast Asia & PacificEast Asia & Pacific (excluding high income)East Asia & Pacific (IDA & IBRD countries)EcuadorEgypt, Arab Rep.El SalvadorEquatorial GuineaEstoniaEthiopiaEuro areaEurope & Central AsiaEurope & Central Asia (excluding high income)Europe & Central Asia (IDA & IBRD countries)European UnionFaroe IslandsFijiFinlandFragile and conflict affected situationsFranceFrench PolynesiaGabonGambia, TheGeorgiaGermanyGhanaGibraltarGreeceGreenlandGrenadaGuamGuatemalaGuineaGuinea-BissauGuyanaHaitiHeavily indebted poor countries (HIPC)High incomeHondurasHong Kong SAR, ChinaHungaryIBRD onlyIcelandIDA & IBRD totalIDA blendIDA onlyIDA totalIndiaIndonesiaIran, Islamic Rep.IraqIrelandIsraelItalyJamaicaJapanJordanKazakhstanKenyaKiribatiKorea, Dem. People’s Rep.Korea, Rep.KosovoKuwaitKyrgyz RepublicLao PDRLate-demographic dividendLatin America & Caribbean Latin America & Caribbean (excluding high income)Latin America & the Caribbean (IDA & IBRD countries)LatviaLeast developed countries: UN classificationLebanonLiberiaLibyaLithuaniaLow & middle incomeLow incomeLower middle incomeLuxembourgMacao SAR, ChinaMacedonia, FYRMadagascarMalawiMalaysiaMaldivesMaliMaltaMauritaniaMauritiusMexicoMiddle East & North AfricaMiddle East & North Africa (excluding high income)Middle East & North Africa (IDA & IBRD countries)Middle incomeMoldovaMongoliaMontenegroMoroccoMozambiqueMyanmarNauruNepalNetherlandsNew CaledoniaNew ZealandNicaraguaNigerNigeriaNorth AmericaNorwayOECD membersOmanOther small statesPacific island small statesPakistanPanamaPapua New GuineaParaguayPeruPhilippinesPolandPortugalPost-demographic dividendPre-demographic dividendQatarRomaniaRussian FederationRwandaSamoaSao Tome and PrincipeSaudi ArabiaSenegalSerbiaSeychellesSierra LeoneSingaporeSlovak RepublicSloveniaSmall statesSolomon IslandsSomaliaSouth AfricaSouth AsiaSouth Asia (IDA & IBRD)SpainSri LankaSt. Kitts and NevisSt. LuciaSt. Vincent and the GrenadinesSub-Saharan Africa Sub-Saharan Africa (excluding high income)Sub-Saharan Africa (IDA & IBRD countries)SudanSurinameSwedenSwitzerlandSyrian Arab RepublicTajikistanTanzaniaThailandTogoTongaTrinidad and TobagoTunisiaTurkeyTurkmenistanTuvaluUgandaUkraineUnited Arab EmiratesUnited KingdomUnited StatesUpper middle incomeUruguayUzbekistanVanuatuVenezuela, RBVietnamWorldYemen, Rep.ZambiaZimbabwe Timeline:
This timeline shows a graph from 1964 to 2015 of Macao SAR, China. No data until 1963. Number of actual observations by date: 51.
Source name:
World Development Indicators
Source organization:
World Bank staff estimates based data from International Monetary Fund's Direction of Trade database.
Categories, topics:
Private Sector, Trade
Last updated:
apr 23, 2017
Indicators value changes by year
Minimum:
50.598
jan 1, 2007
Maximum:
80.022
jan 1, 1976
At the date of observation
Value
Absolute change
Change from previous value
jan 1, 1964
65.947
+65.947
0.0%
jan 1, 1965
64.092
-1.855
-2.81%
jan 1, 1966
60.256
-3.835
-5.98%
jan 1, 1967
57.957
-2.3
-3.82%
jan 1, 1968
65.412
+7.455
12.86%
jan 1, 1970
74.242
+8.83
13.5%
jan 1, 1971
72.34
-1.902
-2.56%
jan 1, 1972
72.49
+0.15
0.21%
jan 1, 1973
73.645
+1.156
1.59%
jan 1, 1974
73.642
-0.004
0.0%
jan 1, 1975
74.141
+0.499
0.68%
jan 1, 1976
80.022
+5.881
7.93%
jan 1, 1977
75.439
-4.583
-5.73%
jan 1, 1978
72.905
-2.534
-3.36%
jan 1, 1979
72.935
+0.03
0.04%
jan 1, 1980
69.551
-3.385
-4.64%
jan 1, 1981
73.071
+3.52
5.06%
jan 1, 1982
66.162
-6.909
-9.45%
jan 1, 1983
69.008
+2.846
4.3%
jan 1, 1984
69.986
+0.978
1.42%
jan 1, 1985
69.038
-0.948
-1.36%
jan 1, 1986
76.45
+7.412
10.74%
jan 1, 1987
78.856
+2.406
3.15%
jan 1, 1988
77.685
-1.171
-1.48%
jan 1, 1989
77.564
-0.121
-0.16%
jan 1, 1990
77.798
+0.234
0.3%
jan 1, 1991
79.799
+2.001
2.57%
jan 1, 1992
76.321
-3.478
-4.36%
jan 1, 1993
77.324
+1.003
1.31%
jan 1, 1994
76.584
-0.741
-0.96%
jan 1, 1995
77.48
+0.897
1.17%
jan 1, 1996
74.1
-3.38
-4.36%
jan 1, 1997
72.652
-1.449
-1.96%
jan 1, 1998
68.456
-4.196
-5.78%
jan 1, 1999
63.282
-5.174
-7.56%
jan 1, 2000
59.438
-3.844
-6.07%
jan 1, 2001
55.089
-4.349
-7.32%
jan 1, 2002
53.777
-1.312
-2.38%
jan 1, 2003
54.371
+0.594
1.11%
jan 1, 2004
53.037
-1.335
-2.45%
jan 1, 2005
51.483
-1.554
-2.93%
jan 1, 2006
52.266
+0.783
1.52%
jan 1, 2007
50.598
-1.668
-3.19%
jan 1, 2008
53.223
+2.626
5.19%
jan 1, 2009
56.091
+2.868
5.39%
jan 1, 2010
63.238
+7.146
12.74%
jan 1, 2011
63.403
+0.166
0.26%
jan 1, 2012
64.577
+1.174
1.85%
jan 1, 2013
62.988
-1.589
-2.46%
jan 1, 2014
63.386
+0.398
0.63%
jan 1, 2015
62.956
-0.43
-0.68%
Ranking of countries by current statistics by years


Comments: