29
/
en
AIzaSyAYiBZKx7MnpbEhh9jyipgxe19OcubqV5w
April 1, 2024
42625
Latin America & Caribbean (excluding high income)
LAC
false
2
1
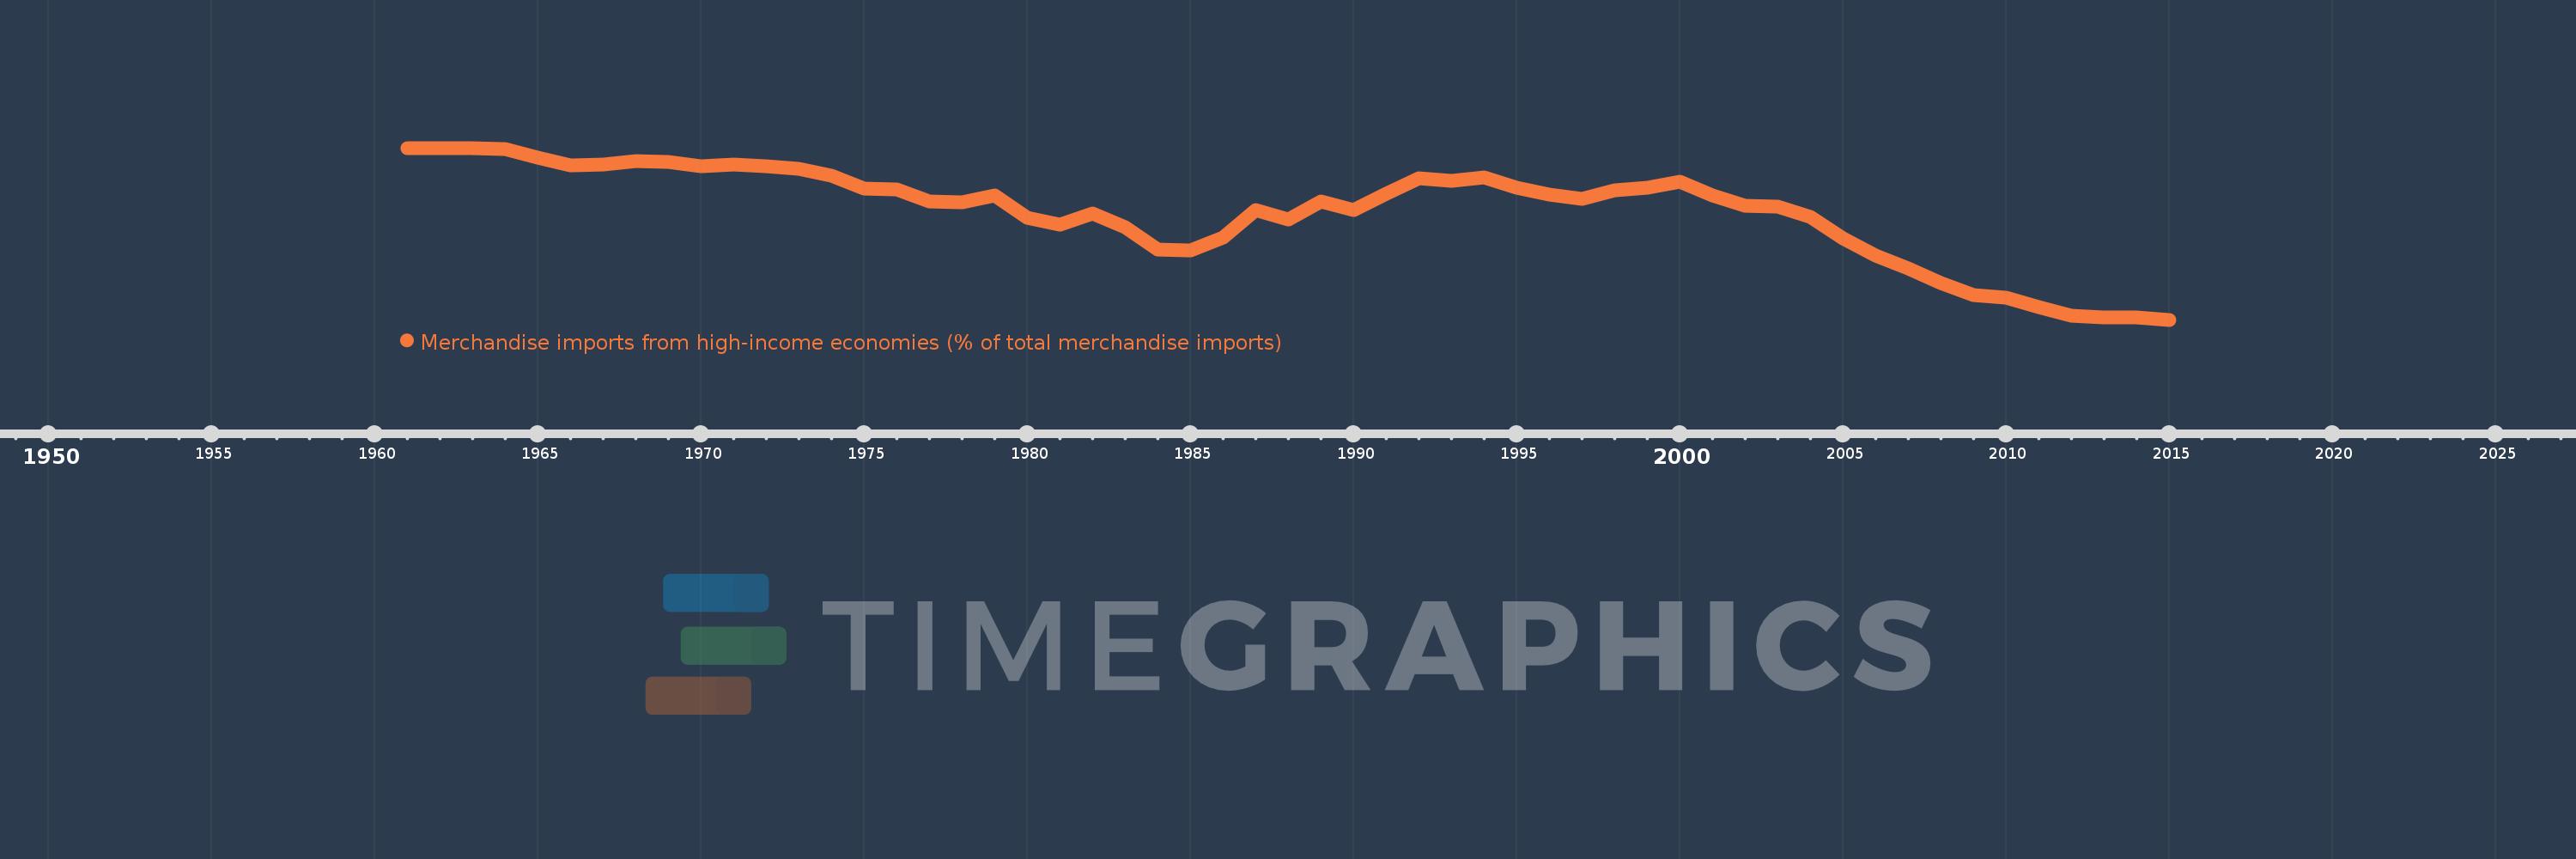
Merchandise imports from high-income economies (% of total merchandise imports)
2015,2014,2013,2012,2011,2010,2009,2008,2007,2006,2005,2004,2003,2002,2001,2000,1999,1998,1997,1996,1995,1994,1993,1992,1991,1990,1989,1988,1987,1986,1985,1984,1983,1982,1981,1980,1979,1978,1977,1976,1975,1974,1973,1972,1971,1970,1969,1968,1967,1966,1965,1964,1963,1962,1961
This statistics in other country:
AfghanistanAlbaniaAlgeriaAngolaAntigua and BarbudaArab WorldArgentinaArmeniaArubaAustraliaAustriaAzerbaijanBahamas, TheBahrainBangladeshBarbadosBelarusBelgiumBelizeBeninBermudaBoliviaBosnia and HerzegovinaBrazilBrunei DarussalamBulgariaBurkina FasoBurundiCabo VerdeCambodiaCameroonCanadaCaribbean small statesCentral African RepublicCentral Europe and the BalticsChadChileChinaColombiaComorosCongo, Dem. Rep.Congo, Rep.Costa RicaCote d'IvoireCroatiaCubaCyprusCzech RepublicDenmarkDjiboutiDominicaDominican RepublicEarly-demographic dividendEast Asia & PacificEast Asia & Pacific (excluding high income)East Asia & Pacific (IDA & IBRD countries)EcuadorEgypt, Arab Rep.El SalvadorEquatorial GuineaEstoniaEthiopiaEuro areaEurope & Central AsiaEurope & Central Asia (excluding high income)Europe & Central Asia (IDA & IBRD countries)European UnionFaroe IslandsFijiFinlandFragile and conflict affected situationsFranceFrench PolynesiaGabonGambia, TheGeorgiaGermanyGhanaGibraltarGreeceGreenlandGrenadaGuamGuatemalaGuineaGuinea-BissauGuyanaHaitiHeavily indebted poor countries (HIPC)High incomeHondurasHong Kong SAR, ChinaHungaryIBRD onlyIcelandIDA & IBRD totalIDA blendIDA onlyIDA totalIndiaIndonesiaIran, Islamic Rep.IraqIrelandIsraelItalyJamaicaJapanJordanKazakhstanKenyaKiribatiKorea, Dem. People’s Rep.Korea, Rep.KosovoKuwaitKyrgyz RepublicLao PDRLate-demographic dividendLatin America & Caribbean Latin America & Caribbean (excluding high income)Latin America & the Caribbean (IDA & IBRD countries)LatviaLeast developed countries: UN classificationLebanonLiberiaLibyaLithuaniaLow & middle incomeLow incomeLower middle incomeLuxembourgMacao SAR, ChinaMacedonia, FYRMadagascarMalawiMalaysiaMaldivesMaliMaltaMauritaniaMauritiusMexicoMiddle East & North AfricaMiddle East & North Africa (excluding high income)Middle East & North Africa (IDA & IBRD countries)Middle incomeMoldovaMongoliaMontenegroMoroccoMozambiqueMyanmarNauruNepalNetherlandsNew CaledoniaNew ZealandNicaraguaNigerNigeriaNorth AmericaNorwayOECD membersOmanOther small statesPacific island small statesPakistanPanamaPapua New GuineaParaguayPeruPhilippinesPolandPortugalPost-demographic dividendPre-demographic dividendQatarRomaniaRussian FederationRwandaSamoaSao Tome and PrincipeSaudi ArabiaSenegalSerbiaSeychellesSierra LeoneSingaporeSlovak RepublicSloveniaSmall statesSolomon IslandsSomaliaSouth AfricaSouth AsiaSouth Asia (IDA & IBRD)SpainSri LankaSt. Kitts and NevisSt. LuciaSt. Vincent and the GrenadinesSub-Saharan Africa Sub-Saharan Africa (excluding high income)Sub-Saharan Africa (IDA & IBRD countries)SudanSurinameSwedenSwitzerlandSyrian Arab RepublicTajikistanTanzaniaThailandTogoTongaTrinidad and TobagoTunisiaTurkeyTurkmenistanTuvaluUgandaUkraineUnited Arab EmiratesUnited KingdomUnited StatesUpper middle incomeUruguayUzbekistanVanuatuVenezuela, RBVietnamWorldYemen, Rep.ZambiaZimbabwe Timeline:
This timeline shows a graph from 1961 to 2015 of Latin America & Caribbean (excluding high income). No data until 1960. Number of actual observations by date: 55.
Source name:
World Development Indicators
Source organization:
World Bank staff estimates based data from International Monetary Fund's Direction of Trade database.
Categories, topics:
Private Sector, Trade
Last updated:
apr 23, 2017
Indicators value changes by year
Minimum:
63.357
jan 1, 2015
Maximum:
90.469
jan 1, 1961
At the date of observation
Value
Absolute change
Change from previous value
jan 1, 1961
90.469
+90.469
0.0%
jan 1, 1962
90.424
-0.044
-0.05%
jan 1, 1963
90.465
+0.041
0.05%
jan 1, 1964
90.268
-0.198
-0.22%
jan 1, 1965
88.916
-1.352
-1.5%
jan 1, 1966
87.719
-1.197
-1.35%
jan 1, 1967
87.828
+0.109
0.12%
jan 1, 1968
88.382
+0.554
0.63%
jan 1, 1969
88.233
-0.149
-0.17%
jan 1, 1970
87.648
-0.585
-0.66%
jan 1, 1971
87.901
+0.253
0.29%
jan 1, 1972
87.62
-0.28
-0.32%
jan 1, 1973
87.195
-0.425
-0.49%
jan 1, 1974
86.025
-1.17
-1.34%
jan 1, 1975
84.022
-2.002
-2.33%
jan 1, 1976
83.908
-0.115
-0.14%
jan 1, 1977
82.072
-1.835
-2.19%
jan 1, 1978
81.931
-0.141
-0.17%
jan 1, 1979
82.947
+1.016
1.24%
jan 1, 1980
79.48
-3.466
-4.18%
jan 1, 1981
78.306
-1.174
-1.48%
jan 1, 1982
80.094
+1.788
2.28%
jan 1, 1983
77.904
-2.19
-2.73%
jan 1, 1984
74.484
-3.42
-4.39%
jan 1, 1985
74.347
-0.137
-0.18%
jan 1, 1986
76.373
+2.026
2.72%
jan 1, 1987
80.604
+4.231
5.54%
jan 1, 1988
79.159
-1.445
-1.79%
jan 1, 1989
82.08
+2.921
3.69%
jan 1, 1990
80.689
-1.39
-1.69%
jan 1, 1991
83.214
+2.525
3.13%
jan 1, 1992
85.675
+2.461
2.96%
jan 1, 1993
85.307
-0.368
-0.43%
jan 1, 1994
85.819
+0.512
0.6%
jan 1, 1995
84.216
-1.604
-1.87%
jan 1, 1996
83.167
-1.048
-1.24%
jan 1, 1997
82.459
-0.708
-0.85%
jan 1, 1998
83.791
+1.332
1.61%
jan 1, 1999
84.182
+0.391
0.47%
jan 1, 2000
85.131
+0.949
1.13%
jan 1, 2001
82.971
-2.16
-2.54%
jan 1, 2002
81.379
-1.592
-1.92%
jan 1, 2003
81.162
-0.218
-0.27%
jan 1, 2004
79.573
-1.589
-1.96%
jan 1, 2005
76.131
-3.441
-4.32%
jan 1, 2006
73.504
-2.627
-3.45%
jan 1, 2007
71.406
-2.098
-2.85%
jan 1, 2008
69.206
-2.2
-3.08%
jan 1, 2009
67.234
-1.972
-2.85%
jan 1, 2010
66.818
-0.415
-0.62%
jan 1, 2011
65.383
-1.436
-2.15%
jan 1, 2012
64.034
-1.349
-2.06%
jan 1, 2013
63.694
-0.34
-0.53%
jan 1, 2014
63.656
-0.038
-0.06%
jan 1, 2015
63.357
-0.299
-0.47%
Ranking of countries by current statistics by years


Comments: