29
/
en
AIzaSyAYiBZKx7MnpbEhh9jyipgxe19OcubqV5w
April 1, 2024
135795
Gabon
GAB
true
2
1
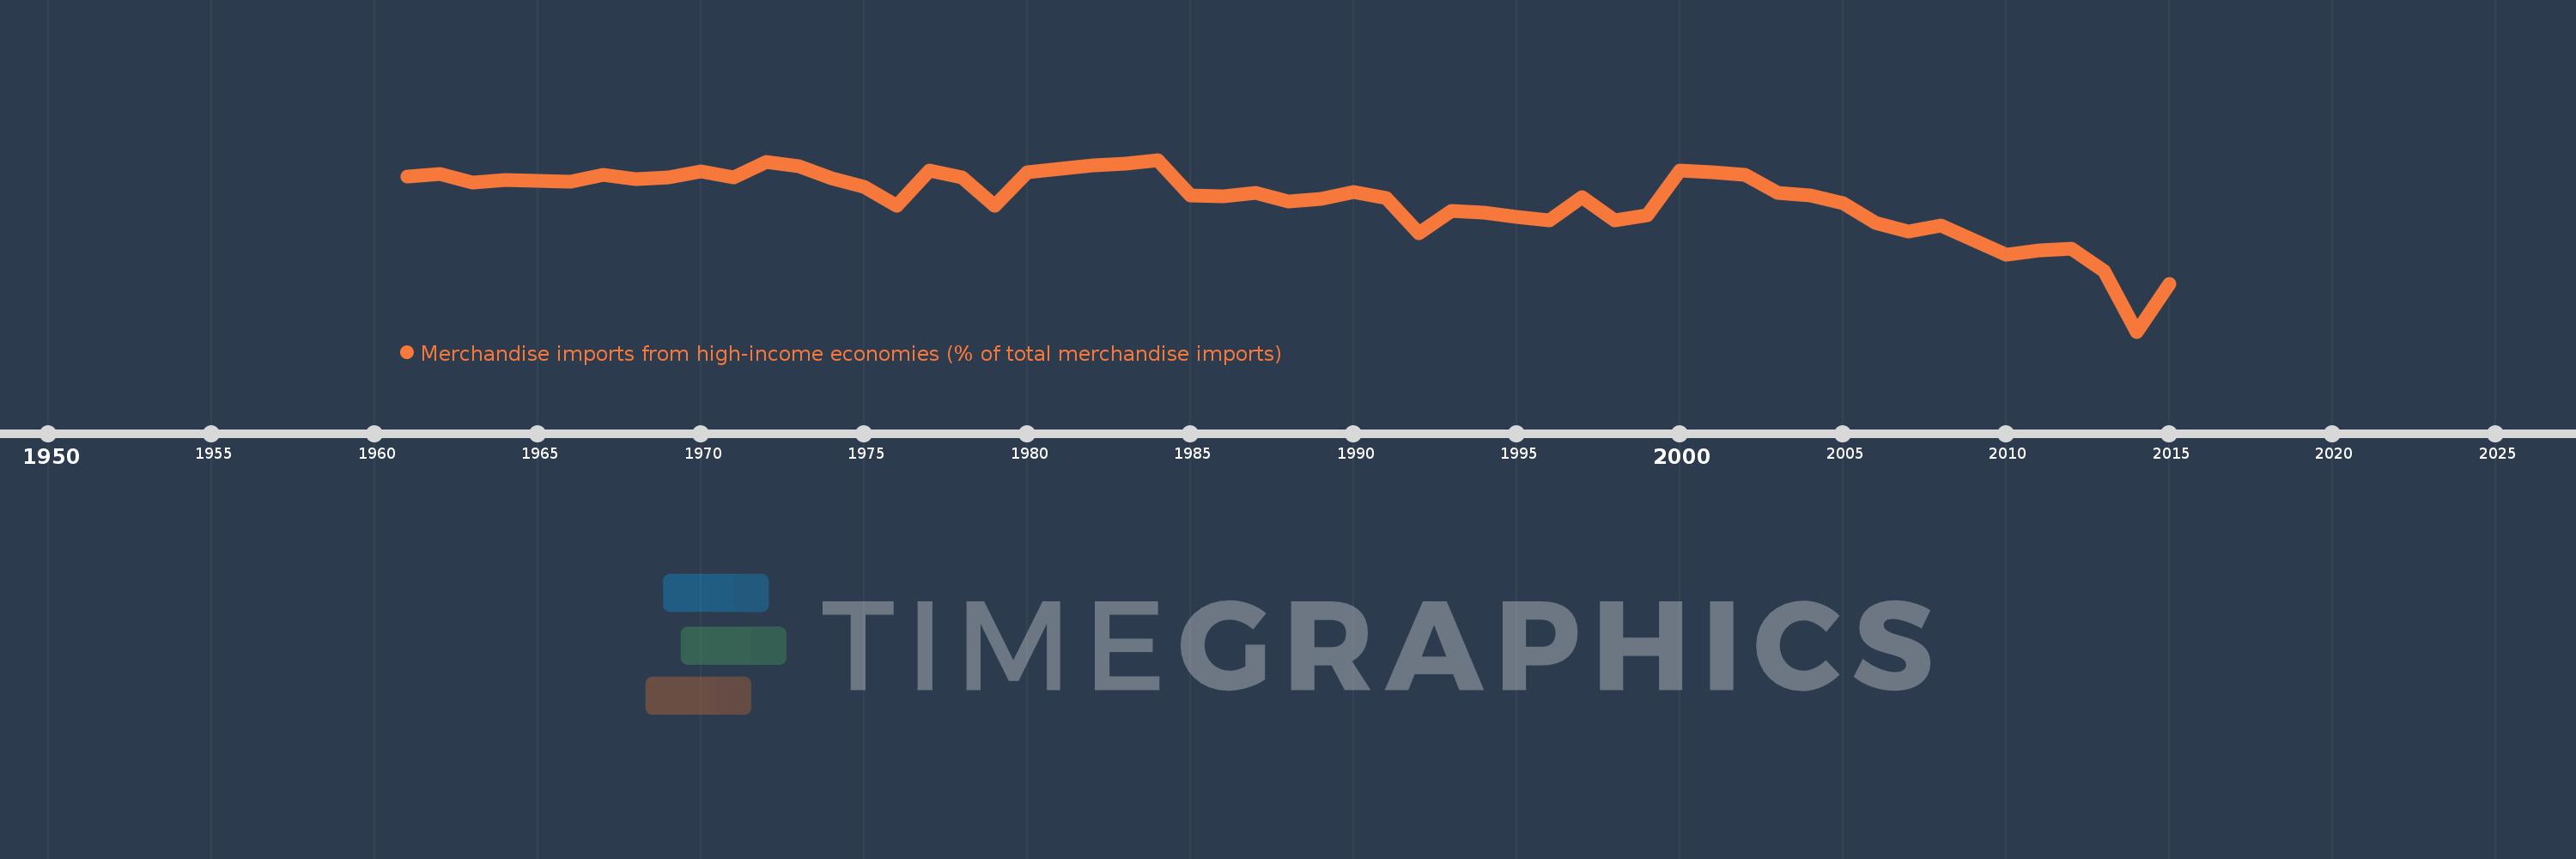
Merchandise imports from high-income economies (% of total merchandise imports)
2015,2014,2013,2012,2011,2010,2009,2008,2007,2006,2005,2004,2003,2002,2001,2000,1999,1998,1997,1996,1995,1994,1993,1992,1991,1990,1989,1988,1987,1986,1985,1984,1983,1982,1981,1980,1979,1978,1977,1976,1975,1974,1973,1972,1971,1970,1969,1968,1967,1966,1965,1964,1963,1962,1961
This statistics in other country:
AfghanistanAlbaniaAlgeriaAngolaAntigua and BarbudaArab WorldArgentinaArmeniaArubaAustraliaAustriaAzerbaijanBahamas, TheBahrainBangladeshBarbadosBelarusBelgiumBelizeBeninBermudaBoliviaBosnia and HerzegovinaBrazilBrunei DarussalamBulgariaBurkina FasoBurundiCabo VerdeCambodiaCameroonCanadaCaribbean small statesCentral African RepublicCentral Europe and the BalticsChadChileChinaColombiaComorosCongo, Dem. Rep.Congo, Rep.Costa RicaCote d'IvoireCroatiaCubaCyprusCzech RepublicDenmarkDjiboutiDominicaDominican RepublicEarly-demographic dividendEast Asia & PacificEast Asia & Pacific (excluding high income)East Asia & Pacific (IDA & IBRD countries)EcuadorEgypt, Arab Rep.El SalvadorEquatorial GuineaEstoniaEthiopiaEuro areaEurope & Central AsiaEurope & Central Asia (excluding high income)Europe & Central Asia (IDA & IBRD countries)European UnionFaroe IslandsFijiFinlandFragile and conflict affected situationsFranceFrench PolynesiaGabonGambia, TheGeorgiaGermanyGhanaGibraltarGreeceGreenlandGrenadaGuamGuatemalaGuineaGuinea-BissauGuyanaHaitiHeavily indebted poor countries (HIPC)High incomeHondurasHong Kong SAR, ChinaHungaryIBRD onlyIcelandIDA & IBRD totalIDA blendIDA onlyIDA totalIndiaIndonesiaIran, Islamic Rep.IraqIrelandIsraelItalyJamaicaJapanJordanKazakhstanKenyaKiribatiKorea, Dem. People’s Rep.Korea, Rep.KosovoKuwaitKyrgyz RepublicLao PDRLate-demographic dividendLatin America & Caribbean Latin America & Caribbean (excluding high income)Latin America & the Caribbean (IDA & IBRD countries)LatviaLeast developed countries: UN classificationLebanonLiberiaLibyaLithuaniaLow & middle incomeLow incomeLower middle incomeLuxembourgMacao SAR, ChinaMacedonia, FYRMadagascarMalawiMalaysiaMaldivesMaliMaltaMauritaniaMauritiusMexicoMiddle East & North AfricaMiddle East & North Africa (excluding high income)Middle East & North Africa (IDA & IBRD countries)Middle incomeMoldovaMongoliaMontenegroMoroccoMozambiqueMyanmarNauruNepalNetherlandsNew CaledoniaNew ZealandNicaraguaNigerNigeriaNorth AmericaNorwayOECD membersOmanOther small statesPacific island small statesPakistanPanamaPapua New GuineaParaguayPeruPhilippinesPolandPortugalPost-demographic dividendPre-demographic dividendQatarRomaniaRussian FederationRwandaSamoaSao Tome and PrincipeSaudi ArabiaSenegalSerbiaSeychellesSierra LeoneSingaporeSlovak RepublicSloveniaSmall statesSolomon IslandsSomaliaSouth AfricaSouth AsiaSouth Asia (IDA & IBRD)SpainSri LankaSt. Kitts and NevisSt. LuciaSt. Vincent and the GrenadinesSub-Saharan Africa Sub-Saharan Africa (excluding high income)Sub-Saharan Africa (IDA & IBRD countries)SudanSurinameSwedenSwitzerlandSyrian Arab RepublicTajikistanTanzaniaThailandTogoTongaTrinidad and TobagoTunisiaTurkeyTurkmenistanTuvaluUgandaUkraineUnited Arab EmiratesUnited KingdomUnited StatesUpper middle incomeUruguayUzbekistanVanuatuVenezuela, RBVietnamWorldYemen, Rep.ZambiaZimbabwe Timeline:
This timeline shows a graph from 1961 to 2015 of Gabon. No data until 1960. Number of actual observations by date: 55.
Source name:
World Development Indicators
Source organization:
World Bank staff estimates based data from International Monetary Fund's Direction of Trade database.
Categories, topics:
Private Sector, Trade
Last updated:
apr 23, 2017
Indicators value changes by year
Minimum:
50.045
jan 1, 2014
Maximum:
93.912
jan 1, 1984
At the date of observation
Value
Absolute change
Change from previous value
jan 1, 1961
89.623
+89.623
0.0%
jan 1, 1962
90.223
+0.601
0.67%
jan 1, 1963
88.144
-2.079
-2.3%
jan 1, 1964
88.773
+0.629
0.71%
jan 1, 1965
88.468
-0.305
-0.34%
jan 1, 1966
88.283
-0.186
-0.21%
jan 1, 1967
90.06
+1.778
2.01%
jan 1, 1968
89.037
-1.023
-1.14%
jan 1, 1969
89.342
+0.305
0.34%
jan 1, 1970
90.941
+1.599
1.79%
jan 1, 1971
89.368
-1.572
-1.73%
jan 1, 1972
93.382
+4.014
4.49%
jan 1, 1973
92.293
-1.089
-1.17%
jan 1, 1974
89.203
-3.09
-3.35%
jan 1, 1975
86.916
-2.287
-2.56%
jan 1, 1976
82.226
-4.69
-5.4%
jan 1, 1977
91.203
+8.977
10.92%
jan 1, 1978
89.463
-1.739
-1.91%
jan 1, 1979
82.262
-7.202
-8.05%
jan 1, 1980
90.802
+8.54
10.38%
jan 1, 1981
91.527
+0.725
0.8%
jan 1, 1982
92.518
+0.991
1.08%
jan 1, 1983
92.981
+0.464
0.5%
jan 1, 1984
93.912
+0.931
1.0%
jan 1, 1985
84.729
-9.183
-9.78%
jan 1, 1986
84.629
-0.099
-0.12%
jan 1, 1987
85.466
+0.837
0.99%
jan 1, 1988
83.165
-2.301
-2.69%
jan 1, 1989
83.837
+0.672
0.81%
jan 1, 1990
85.778
+1.941
2.31%
jan 1, 1991
84.205
-1.573
-1.83%
jan 1, 1992
75.165
-9.04
-10.74%
jan 1, 1993
80.799
+5.634
7.5%
jan 1, 1994
80.431
-0.367
-0.45%
jan 1, 1995
79.337
-1.094
-1.36%
jan 1, 1996
78.396
-0.941
-1.19%
jan 1, 1997
84.357
+5.961
7.6%
jan 1, 1998
78.389
-5.968
-7.08%
jan 1, 1999
79.711
+1.322
1.69%
jan 1, 2000
91.07
+11.36
14.25%
jan 1, 2001
90.694
-0.376
-0.41%
jan 1, 2002
89.998
-0.696
-0.77%
jan 1, 2003
85.411
-4.587
-5.1%
jan 1, 2004
84.74
-0.671
-0.79%
jan 1, 2005
82.77
-1.97
-2.32%
jan 1, 2006
77.755
-5.015
-6.06%
jan 1, 2007
75.617
-2.138
-2.75%
jan 1, 2008
77.197
+1.58
2.09%
jan 1, 2009
73.437
-3.76
-4.87%
jan 1, 2010
69.612
-3.826
-5.21%
jan 1, 2011
70.731
+1.119
1.61%
jan 1, 2012
71.264
+0.533
0.75%
jan 1, 2013
65.45
-5.814
-8.16%
jan 1, 2014
50.045
-15.405
-23.54%
jan 1, 2015
62.15
+12.105
24.19%
Ranking of countries by current statistics by years


Comments: