29
/
en
AIzaSyAYiBZKx7MnpbEhh9jyipgxe19OcubqV5w
April 1, 2024
117154
Cyprus
CYP
true
2
1
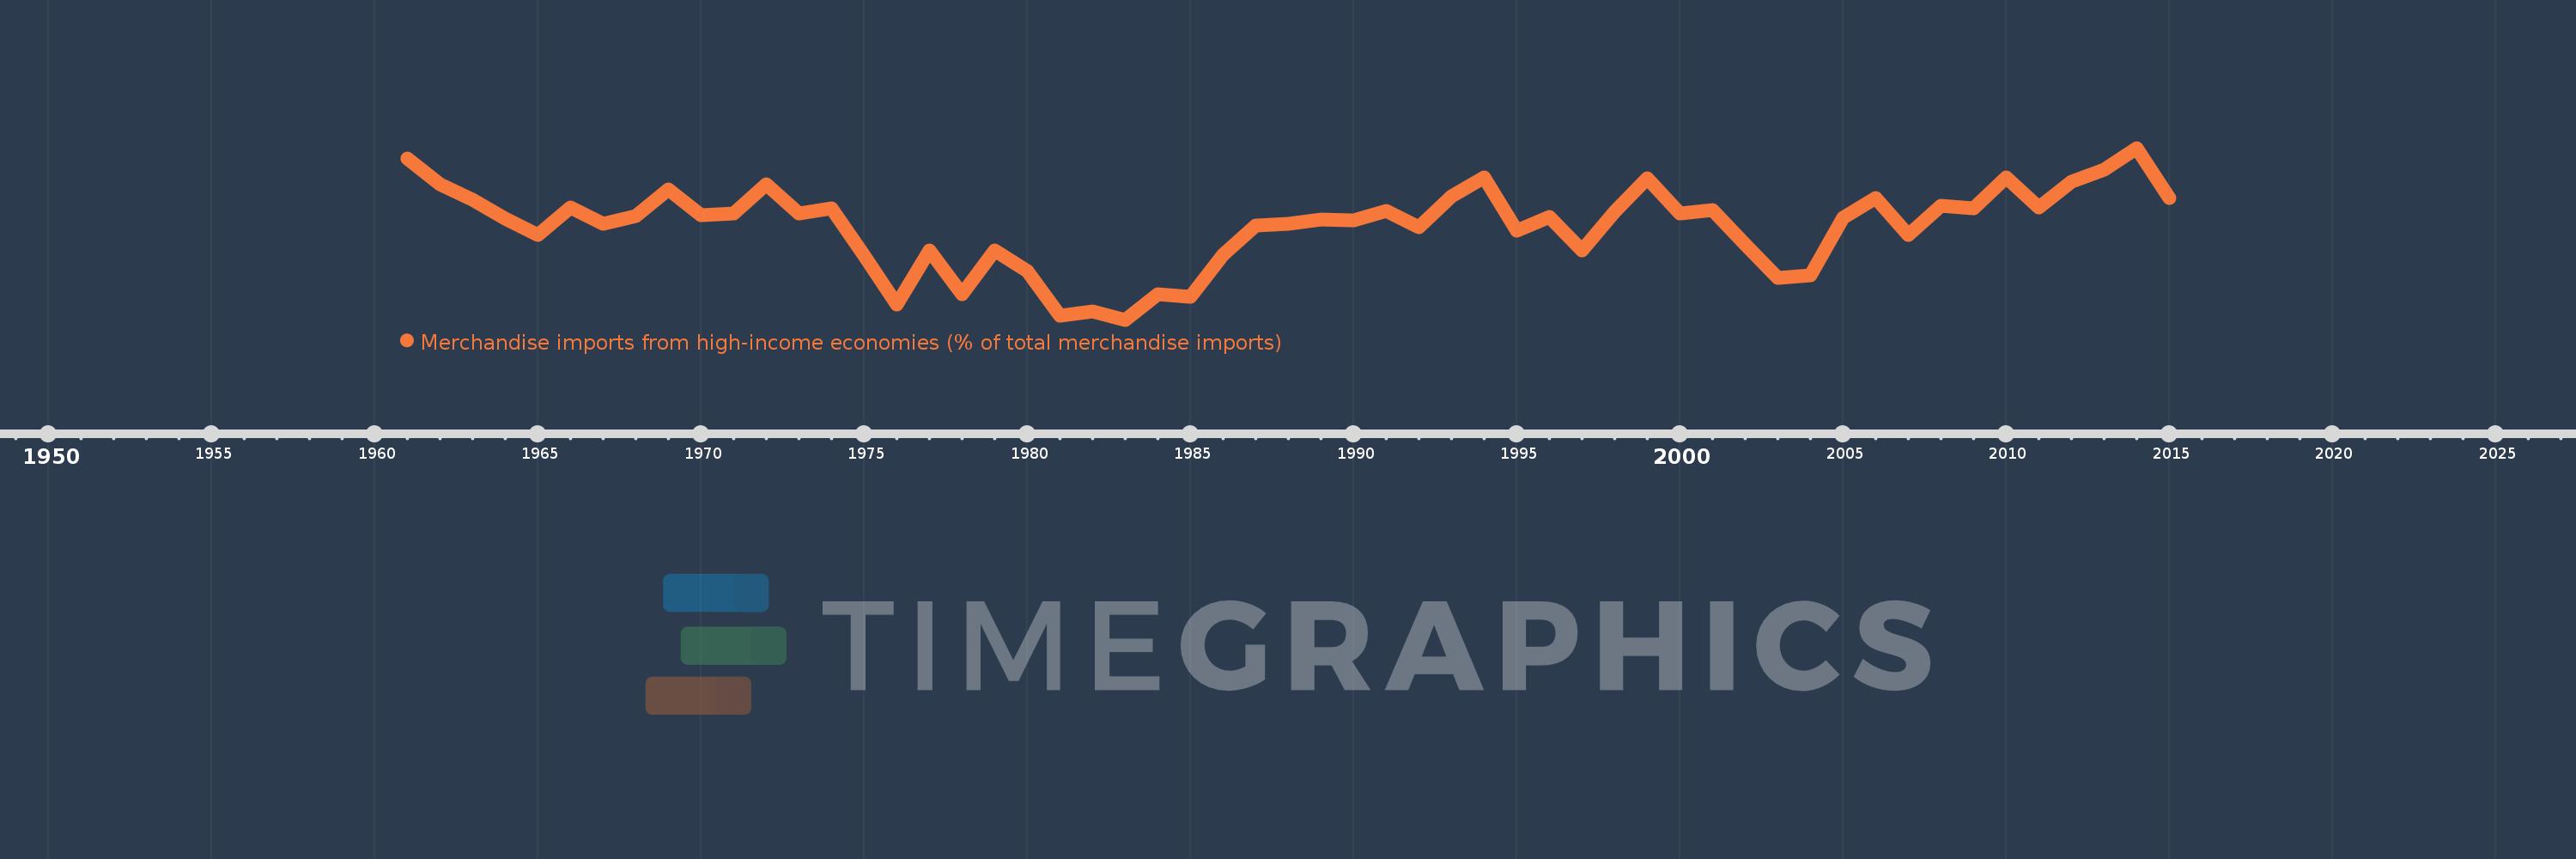
Merchandise imports from high-income economies (% of total merchandise imports)
2015,2014,2013,2012,2011,2010,2009,2008,2007,2006,2005,2004,2003,2002,2001,2000,1999,1998,1997,1996,1995,1994,1993,1992,1991,1990,1989,1988,1987,1986,1985,1984,1983,1982,1981,1980,1979,1978,1977,1976,1975,1974,1973,1972,1971,1970,1969,1968,1967,1966,1965,1964,1963,1962,1961
This statistics in other country:
AfghanistanAlbaniaAlgeriaAngolaAntigua and BarbudaArab WorldArgentinaArmeniaArubaAustraliaAustriaAzerbaijanBahamas, TheBahrainBangladeshBarbadosBelarusBelgiumBelizeBeninBermudaBoliviaBosnia and HerzegovinaBrazilBrunei DarussalamBulgariaBurkina FasoBurundiCabo VerdeCambodiaCameroonCanadaCaribbean small statesCentral African RepublicCentral Europe and the BalticsChadChileChinaColombiaComorosCongo, Dem. Rep.Congo, Rep.Costa RicaCote d'IvoireCroatiaCubaCyprusCzech RepublicDenmarkDjiboutiDominicaDominican RepublicEarly-demographic dividendEast Asia & PacificEast Asia & Pacific (excluding high income)East Asia & Pacific (IDA & IBRD countries)EcuadorEgypt, Arab Rep.El SalvadorEquatorial GuineaEstoniaEthiopiaEuro areaEurope & Central AsiaEurope & Central Asia (excluding high income)Europe & Central Asia (IDA & IBRD countries)European UnionFaroe IslandsFijiFinlandFragile and conflict affected situationsFranceFrench PolynesiaGabonGambia, TheGeorgiaGermanyGhanaGibraltarGreeceGreenlandGrenadaGuamGuatemalaGuineaGuinea-BissauGuyanaHaitiHeavily indebted poor countries (HIPC)High incomeHondurasHong Kong SAR, ChinaHungaryIBRD onlyIcelandIDA & IBRD totalIDA blendIDA onlyIDA totalIndiaIndonesiaIran, Islamic Rep.IraqIrelandIsraelItalyJamaicaJapanJordanKazakhstanKenyaKiribatiKorea, Dem. People’s Rep.Korea, Rep.KosovoKuwaitKyrgyz RepublicLao PDRLate-demographic dividendLatin America & Caribbean Latin America & Caribbean (excluding high income)Latin America & the Caribbean (IDA & IBRD countries)LatviaLeast developed countries: UN classificationLebanonLiberiaLibyaLithuaniaLow & middle incomeLow incomeLower middle incomeLuxembourgMacao SAR, ChinaMacedonia, FYRMadagascarMalawiMalaysiaMaldivesMaliMaltaMauritaniaMauritiusMexicoMiddle East & North AfricaMiddle East & North Africa (excluding high income)Middle East & North Africa (IDA & IBRD countries)Middle incomeMoldovaMongoliaMontenegroMoroccoMozambiqueMyanmarNauruNepalNetherlandsNew CaledoniaNew ZealandNicaraguaNigerNigeriaNorth AmericaNorwayOECD membersOmanOther small statesPacific island small statesPakistanPanamaPapua New GuineaParaguayPeruPhilippinesPolandPortugalPost-demographic dividendPre-demographic dividendQatarRomaniaRussian FederationRwandaSamoaSao Tome and PrincipeSaudi ArabiaSenegalSerbiaSeychellesSierra LeoneSingaporeSlovak RepublicSloveniaSmall statesSolomon IslandsSomaliaSouth AfricaSouth AsiaSouth Asia (IDA & IBRD)SpainSri LankaSt. Kitts and NevisSt. LuciaSt. Vincent and the GrenadinesSub-Saharan Africa Sub-Saharan Africa (excluding high income)Sub-Saharan Africa (IDA & IBRD countries)SudanSurinameSwedenSwitzerlandSyrian Arab RepublicTajikistanTanzaniaThailandTogoTongaTrinidad and TobagoTunisiaTurkeyTurkmenistanTuvaluUgandaUkraineUnited Arab EmiratesUnited KingdomUnited StatesUpper middle incomeUruguayUzbekistanVanuatuVenezuela, RBVietnamWorldYemen, Rep.ZambiaZimbabwe Timeline:
This timeline shows a graph from 1961 to 2015 of Cyprus. No data until 1960. Number of actual observations by date: 55.
Source name:
World Development Indicators
Source organization:
World Bank staff estimates based data from International Monetary Fund's Direction of Trade database.
Categories, topics:
Private Sector, Trade
Last updated:
apr 23, 2017
Indicators value changes by year
Minimum:
76.638
jan 1, 1983
Maximum:
88.977
jan 1, 2014
At the date of observation
Value
Absolute change
Change from previous value
jan 1, 1961
88.219
+88.219
0.0%
jan 1, 1962
86.364
-1.856
-2.1%
jan 1, 1963
85.233
-1.131
-1.31%
jan 1, 1964
83.881
-1.352
-1.59%
jan 1, 1965
82.713
-1.168
-1.39%
jan 1, 1966
84.723
+2.011
2.43%
jan 1, 1967
83.539
-1.185
-1.4%
jan 1, 1968
84.054
+0.516
0.62%
jan 1, 1969
85.976
+1.922
2.29%
jan 1, 1970
84.128
-1.848
-2.15%
jan 1, 1971
84.267
+0.139
0.17%
jan 1, 1972
86.375
+2.108
2.5%
jan 1, 1973
84.261
-2.114
-2.45%
jan 1, 1974
84.66
+0.398
0.47%
jan 1, 1975
81.227
-3.433
-4.05%
jan 1, 1976
77.742
-3.485
-4.29%
jan 1, 1977
81.618
+3.876
4.99%
jan 1, 1978
78.467
-3.151
-3.86%
jan 1, 1979
81.641
+3.174
4.05%
jan 1, 1980
80.163
-1.479
-1.81%
jan 1, 1981
76.923
-3.239
-4.04%
jan 1, 1982
77.236
+0.312
0.41%
jan 1, 1983
76.638
-0.597
-0.77%
jan 1, 1984
78.468
+1.829
2.39%
jan 1, 1985
78.301
-0.167
-0.21%
jan 1, 1986
81.321
+3.02
3.86%
jan 1, 1987
83.407
+2.086
2.56%
jan 1, 1988
83.523
+0.116
0.14%
jan 1, 1989
83.815
+0.292
0.35%
jan 1, 1990
83.801
-0.013
-0.02%
jan 1, 1991
84.456
+0.655
0.78%
jan 1, 1992
83.305
-1.151
-1.36%
jan 1, 1993
85.474
+2.169
2.6%
jan 1, 1994
86.833
+1.359
1.59%
jan 1, 1995
83.051
-3.781
-4.35%
jan 1, 1996
83.997
+0.946
1.14%
jan 1, 1997
81.593
-2.404
-2.86%
jan 1, 1998
84.41
+2.817
3.45%
jan 1, 1999
86.78
+2.37
2.81%
jan 1, 2000
84.288
-2.492
-2.87%
jan 1, 2001
84.498
+0.21
0.25%
jan 1, 2002
82.056
-2.442
-2.89%
jan 1, 2003
79.614
-2.442
-2.98%
jan 1, 2004
79.841
+0.227
0.28%
jan 1, 2005
83.967
+4.126
5.17%
jan 1, 2006
85.384
+1.417
1.69%
jan 1, 2007
82.751
-2.633
-3.08%
jan 1, 2008
84.824
+2.073
2.51%
jan 1, 2009
84.635
-0.189
-0.22%
jan 1, 2010
86.875
+2.24
2.65%
jan 1, 2011
84.673
-2.202
-2.53%
jan 1, 2012
86.557
+1.884
2.23%
jan 1, 2013
87.399
+0.842
0.97%
jan 1, 2014
88.977
+1.578
1.81%
jan 1, 2015
85.364
-3.613
-4.06%
Ranking of countries by current statistics by years


Comments: