29
/
en
AIzaSyAYiBZKx7MnpbEhh9jyipgxe19OcubqV5w
April 1, 2024
191654
Malta
MLT
true
2
1
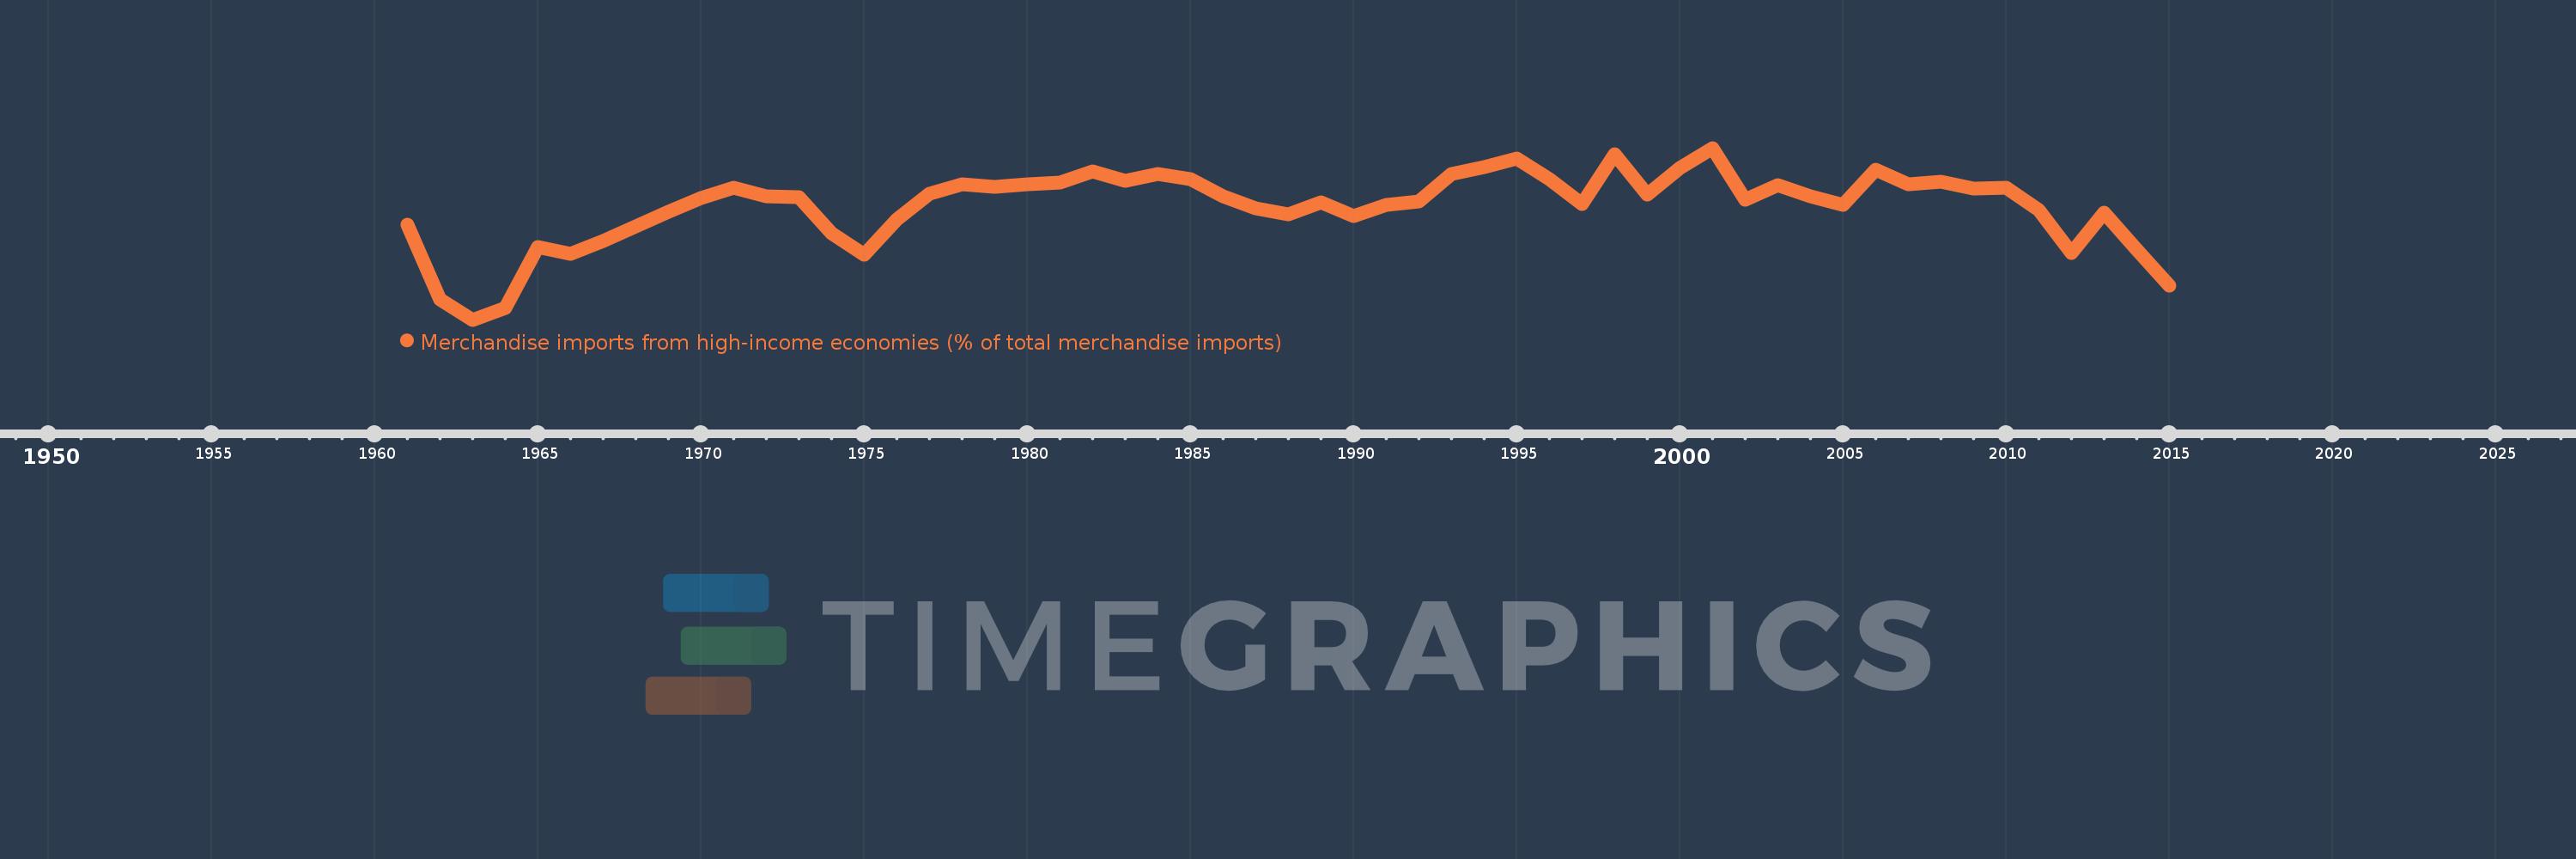
Merchandise imports from high-income economies (% of total merchandise imports)
2015,2014,2013,2012,2011,2010,2009,2008,2007,2006,2005,2004,2003,2002,2001,2000,1999,1998,1997,1996,1995,1994,1993,1992,1991,1990,1989,1988,1987,1986,1985,1984,1983,1982,1981,1980,1979,1978,1977,1976,1975,1974,1973,1972,1971,1970,1969,1968,1967,1966,1965,1964,1963,1962,1961
This statistics in other country:
AfghanistanAlbaniaAlgeriaAngolaAntigua and BarbudaArab WorldArgentinaArmeniaArubaAustraliaAustriaAzerbaijanBahamas, TheBahrainBangladeshBarbadosBelarusBelgiumBelizeBeninBermudaBoliviaBosnia and HerzegovinaBrazilBrunei DarussalamBulgariaBurkina FasoBurundiCabo VerdeCambodiaCameroonCanadaCaribbean small statesCentral African RepublicCentral Europe and the BalticsChadChileChinaColombiaComorosCongo, Dem. Rep.Congo, Rep.Costa RicaCote d'IvoireCroatiaCubaCyprusCzech RepublicDenmarkDjiboutiDominicaDominican RepublicEarly-demographic dividendEast Asia & PacificEast Asia & Pacific (excluding high income)East Asia & Pacific (IDA & IBRD countries)EcuadorEgypt, Arab Rep.El SalvadorEquatorial GuineaEstoniaEthiopiaEuro areaEurope & Central AsiaEurope & Central Asia (excluding high income)Europe & Central Asia (IDA & IBRD countries)European UnionFaroe IslandsFijiFinlandFragile and conflict affected situationsFranceFrench PolynesiaGabonGambia, TheGeorgiaGermanyGhanaGibraltarGreeceGreenlandGrenadaGuamGuatemalaGuineaGuinea-BissauGuyanaHaitiHeavily indebted poor countries (HIPC)High incomeHondurasHong Kong SAR, ChinaHungaryIBRD onlyIcelandIDA & IBRD totalIDA blendIDA onlyIDA totalIndiaIndonesiaIran, Islamic Rep.IraqIrelandIsraelItalyJamaicaJapanJordanKazakhstanKenyaKiribatiKorea, Dem. People’s Rep.Korea, Rep.KosovoKuwaitKyrgyz RepublicLao PDRLate-demographic dividendLatin America & Caribbean Latin America & Caribbean (excluding high income)Latin America & the Caribbean (IDA & IBRD countries)LatviaLeast developed countries: UN classificationLebanonLiberiaLibyaLithuaniaLow & middle incomeLow incomeLower middle incomeLuxembourgMacao SAR, ChinaMacedonia, FYRMadagascarMalawiMalaysiaMaldivesMaliMaltaMauritaniaMauritiusMexicoMiddle East & North AfricaMiddle East & North Africa (excluding high income)Middle East & North Africa (IDA & IBRD countries)Middle incomeMoldovaMongoliaMontenegroMoroccoMozambiqueMyanmarNauruNepalNetherlandsNew CaledoniaNew ZealandNicaraguaNigerNigeriaNorth AmericaNorwayOECD membersOmanOther small statesPacific island small statesPakistanPanamaPapua New GuineaParaguayPeruPhilippinesPolandPortugalPost-demographic dividendPre-demographic dividendQatarRomaniaRussian FederationRwandaSamoaSao Tome and PrincipeSaudi ArabiaSenegalSerbiaSeychellesSierra LeoneSingaporeSlovak RepublicSloveniaSmall statesSolomon IslandsSomaliaSouth AfricaSouth AsiaSouth Asia (IDA & IBRD)SpainSri LankaSt. Kitts and NevisSt. LuciaSt. Vincent and the GrenadinesSub-Saharan Africa Sub-Saharan Africa (excluding high income)Sub-Saharan Africa (IDA & IBRD countries)SudanSurinameSwedenSwitzerlandSyrian Arab RepublicTajikistanTanzaniaThailandTogoTongaTrinidad and TobagoTunisiaTurkeyTurkmenistanTuvaluUgandaUkraineUnited Arab EmiratesUnited KingdomUnited StatesUpper middle incomeUruguayUzbekistanVanuatuVenezuela, RBVietnamWorldYemen, Rep.ZambiaZimbabwe Timeline:
This timeline shows a graph from 1961 to 2015 of Malta. No data until 1960. Number of actual observations by date: 55.
Source name:
World Development Indicators
Source organization:
World Bank staff estimates based data from International Monetary Fund's Direction of Trade database.
Categories, topics:
Private Sector, Trade
Last updated:
apr 23, 2017
Indicators value changes by year
Minimum:
80.278
jan 1, 1963
Maximum:
93.668
jan 1, 2001
At the date of observation
Value
Absolute change
Change from previous value
jan 1, 1961
87.708
+87.708
0.0%
jan 1, 1962
81.886
-5.821
-6.64%
jan 1, 1963
80.278
-1.609
-1.96%
jan 1, 1964
81.173
+0.895
1.12%
jan 1, 1965
85.929
+4.756
5.86%
jan 1, 1966
85.391
-0.538
-0.63%
jan 1, 1967
86.44
+1.049
1.23%
jan 1, 1968
87.556
+1.116
1.29%
jan 1, 1969
88.703
+1.147
1.31%
jan 1, 1970
89.771
+1.069
1.2%
jan 1, 1971
90.561
+0.789
0.88%
jan 1, 1972
89.897
-0.664
-0.73%
jan 1, 1973
89.834
-0.063
-0.07%
jan 1, 1974
87.032
-2.802
-3.12%
jan 1, 1975
85.318
-1.714
-1.97%
jan 1, 1976
88.103
+2.784
3.26%
jan 1, 1977
90.079
+1.976
2.24%
jan 1, 1978
90.847
+0.768
0.85%
jan 1, 1979
90.622
-0.225
-0.25%
jan 1, 1980
90.867
+0.246
0.27%
jan 1, 1981
90.943
+0.076
0.08%
jan 1, 1982
91.864
+0.921
1.01%
jan 1, 1983
91.126
-0.737
-0.8%
jan 1, 1984
91.629
+0.503
0.55%
jan 1, 1985
91.265
-0.365
-0.4%
jan 1, 1986
89.895
-1.37
-1.5%
jan 1, 1987
88.987
-0.907
-1.01%
jan 1, 1988
88.511
-0.477
-0.54%
jan 1, 1989
89.397
+0.886
1.0%
jan 1, 1990
88.352
-1.045
-1.17%
jan 1, 1991
89.206
+0.854
0.97%
jan 1, 1992
89.482
+0.276
0.31%
jan 1, 1993
91.669
+2.186
2.44%
jan 1, 1994
92.205
+0.537
0.59%
jan 1, 1995
92.826
+0.62
0.67%
jan 1, 1996
91.207
-1.618
-1.74%
jan 1, 1997
89.327
-1.88
-2.06%
jan 1, 1998
93.181
+3.854
4.31%
jan 1, 1999
90.052
-3.129
-3.36%
jan 1, 2000
92.139
+2.087
2.32%
jan 1, 2001
93.668
+1.529
1.66%
jan 1, 2002
89.637
-4.03
-4.3%
jan 1, 2003
90.766
+1.129
1.26%
jan 1, 2004
89.91
-0.856
-0.94%
jan 1, 2005
89.233
-0.677
-0.75%
jan 1, 2006
91.999
+2.766
3.1%
jan 1, 2007
90.803
-1.197
-1.3%
jan 1, 2008
91.025
+0.222
0.25%
jan 1, 2009
90.522
-0.503
-0.55%
jan 1, 2010
90.535
+0.013
0.01%
jan 1, 2011
88.839
-1.696
-1.87%
jan 1, 2012
85.492
-3.347
-3.77%
jan 1, 2013
88.608
+3.116
3.65%
jan 1, 2014
85.758
-2.85
-3.22%
jan 1, 2015
82.954
-2.804
-3.27%
Ranking of countries by current statistics by years


Comments: