29
/
en
AIzaSyAYiBZKx7MnpbEhh9jyipgxe19OcubqV5w
April 1, 2024
120116
Djibouti
DJI
true
2
1
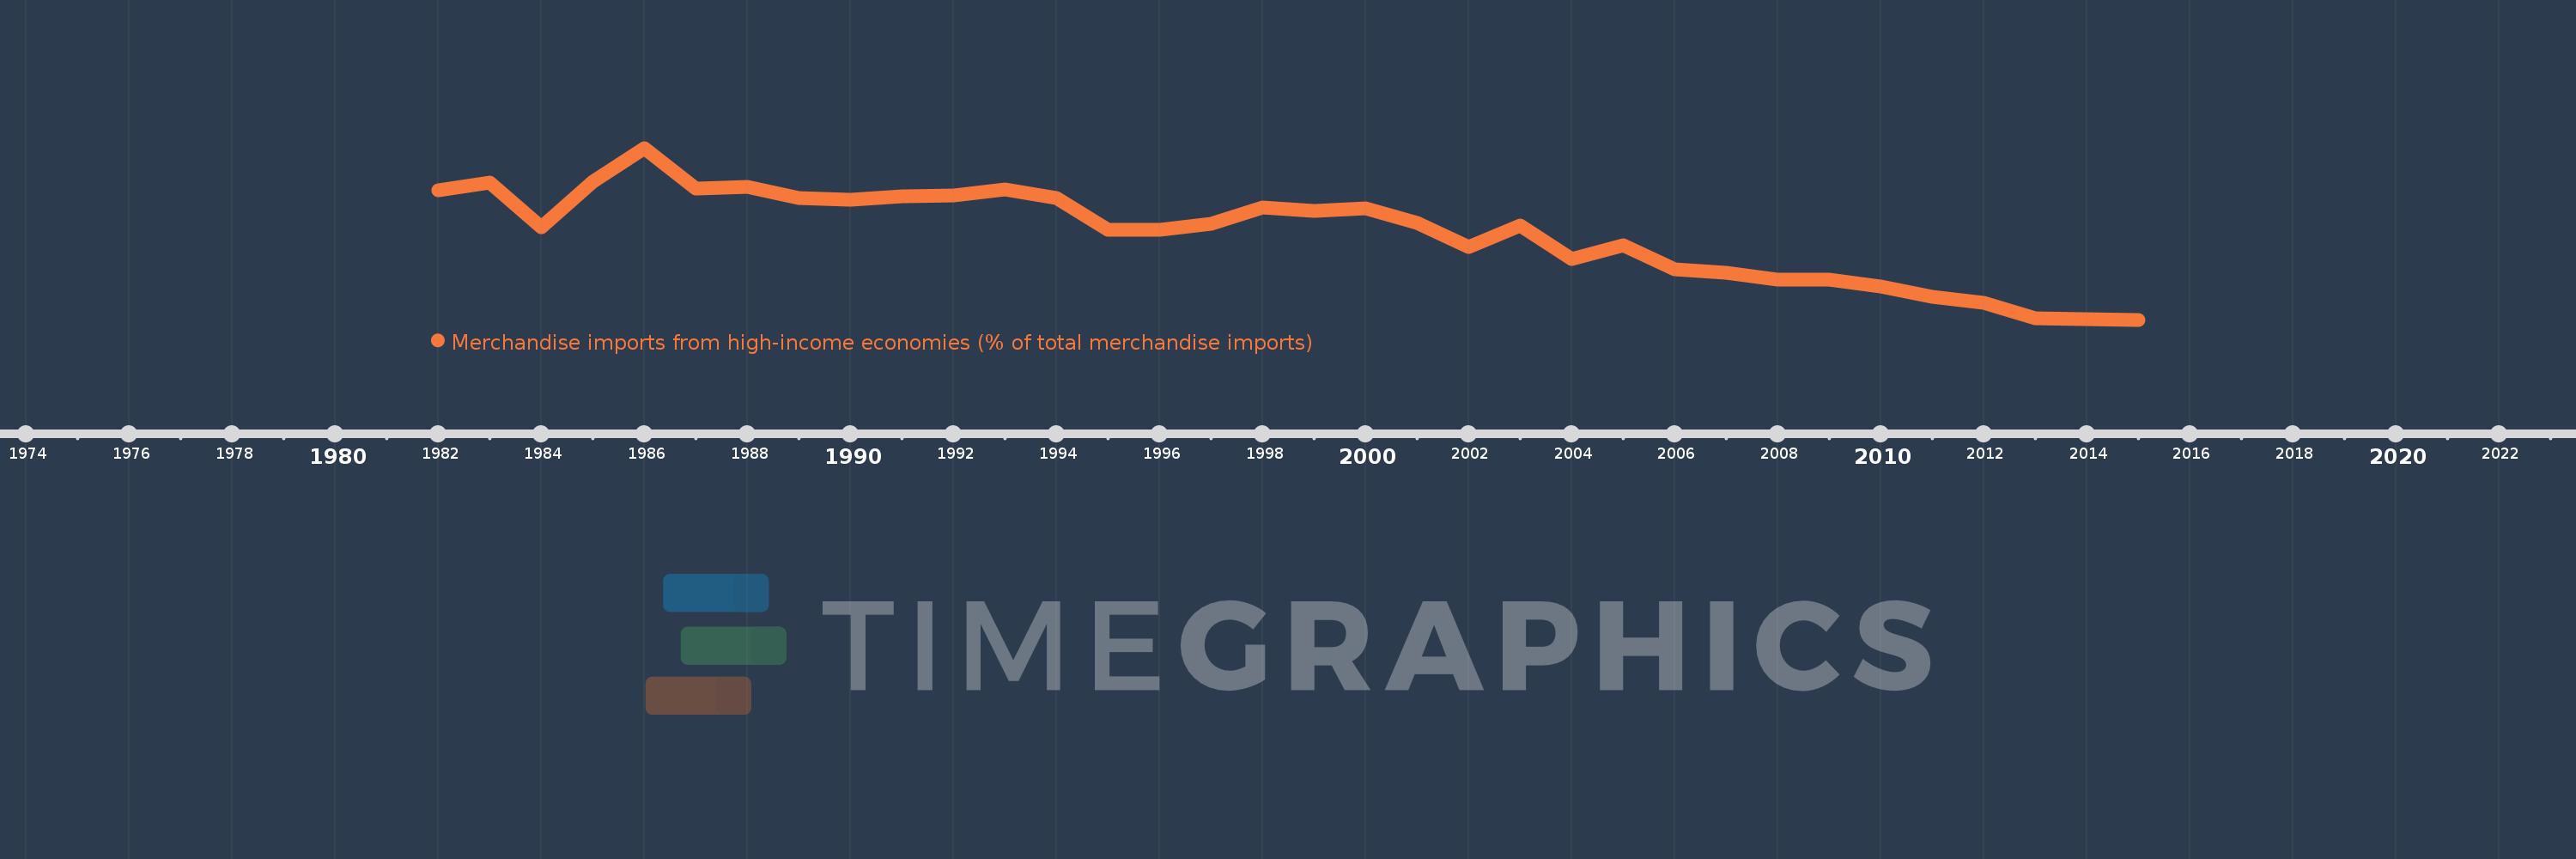
Merchandise imports from high-income economies (% of total merchandise imports)
2015,2014,2013,2012,2011,2010,2009,2008,2007,2006,2005,2004,2003,2002,2001,2000,1999,1998,1997,1996,1995,1994,1993,1992,1991,1990,1989,1988,1987,1986,1985,1984,1983,1982
This statistics in other country:
AfghanistanAlbaniaAlgeriaAngolaAntigua and BarbudaArab WorldArgentinaArmeniaArubaAustraliaAustriaAzerbaijanBahamas, TheBahrainBangladeshBarbadosBelarusBelgiumBelizeBeninBermudaBoliviaBosnia and HerzegovinaBrazilBrunei DarussalamBulgariaBurkina FasoBurundiCabo VerdeCambodiaCameroonCanadaCaribbean small statesCentral African RepublicCentral Europe and the BalticsChadChileChinaColombiaComorosCongo, Dem. Rep.Congo, Rep.Costa RicaCote d'IvoireCroatiaCubaCyprusCzech RepublicDenmarkDjiboutiDominicaDominican RepublicEarly-demographic dividendEast Asia & PacificEast Asia & Pacific (excluding high income)East Asia & Pacific (IDA & IBRD countries)EcuadorEgypt, Arab Rep.El SalvadorEquatorial GuineaEstoniaEthiopiaEuro areaEurope & Central AsiaEurope & Central Asia (excluding high income)Europe & Central Asia (IDA & IBRD countries)European UnionFaroe IslandsFijiFinlandFragile and conflict affected situationsFranceFrench PolynesiaGabonGambia, TheGeorgiaGermanyGhanaGibraltarGreeceGreenlandGrenadaGuamGuatemalaGuineaGuinea-BissauGuyanaHaitiHeavily indebted poor countries (HIPC)High incomeHondurasHong Kong SAR, ChinaHungaryIBRD onlyIcelandIDA & IBRD totalIDA blendIDA onlyIDA totalIndiaIndonesiaIran, Islamic Rep.IraqIrelandIsraelItalyJamaicaJapanJordanKazakhstanKenyaKiribatiKorea, Dem. People’s Rep.Korea, Rep.KosovoKuwaitKyrgyz RepublicLao PDRLate-demographic dividendLatin America & Caribbean Latin America & Caribbean (excluding high income)Latin America & the Caribbean (IDA & IBRD countries)LatviaLeast developed countries: UN classificationLebanonLiberiaLibyaLithuaniaLow & middle incomeLow incomeLower middle incomeLuxembourgMacao SAR, ChinaMacedonia, FYRMadagascarMalawiMalaysiaMaldivesMaliMaltaMauritaniaMauritiusMexicoMiddle East & North AfricaMiddle East & North Africa (excluding high income)Middle East & North Africa (IDA & IBRD countries)Middle incomeMoldovaMongoliaMontenegroMoroccoMozambiqueMyanmarNauruNepalNetherlandsNew CaledoniaNew ZealandNicaraguaNigerNigeriaNorth AmericaNorwayOECD membersOmanOther small statesPacific island small statesPakistanPanamaPapua New GuineaParaguayPeruPhilippinesPolandPortugalPost-demographic dividendPre-demographic dividendQatarRomaniaRussian FederationRwandaSamoaSao Tome and PrincipeSaudi ArabiaSenegalSerbiaSeychellesSierra LeoneSingaporeSlovak RepublicSloveniaSmall statesSolomon IslandsSomaliaSouth AfricaSouth AsiaSouth Asia (IDA & IBRD)SpainSri LankaSt. Kitts and NevisSt. LuciaSt. Vincent and the GrenadinesSub-Saharan Africa Sub-Saharan Africa (excluding high income)Sub-Saharan Africa (IDA & IBRD countries)SudanSurinameSwedenSwitzerlandSyrian Arab RepublicTajikistanTanzaniaThailandTogoTongaTrinidad and TobagoTunisiaTurkeyTurkmenistanTuvaluUgandaUkraineUnited Arab EmiratesUnited KingdomUnited StatesUpper middle incomeUruguayUzbekistanVanuatuVenezuela, RBVietnamWorldYemen, Rep.ZambiaZimbabwe Timeline:
This timeline shows a graph from 1982 to 2015 of Djibouti. No data until 1981. Number of actual observations by date: 34.
Source name:
World Development Indicators
Source organization:
World Bank staff estimates based data from International Monetary Fund's Direction of Trade database.
Categories, topics:
Private Sector, Trade
Last updated:
apr 23, 2017
Indicators value changes by year
Minimum:
34.621
jan 1, 2015
Maximum:
87.032
jan 1, 1986
At the date of observation
Value
Absolute change
Change from previous value
jan 1, 1982
74.158
+74.158
0.0%
jan 1, 1983
76.426
+2.268
3.06%
jan 1, 1984
62.719
-13.707
-17.94%
jan 1, 1985
76.693
+13.975
22.28%
jan 1, 1986
87.032
+10.339
13.48%
jan 1, 1987
74.65
-12.383
-14.23%
jan 1, 1988
75.117
+0.467
0.63%
jan 1, 1989
71.709
-3.408
-4.54%
jan 1, 1990
71.161
-0.548
-0.76%
jan 1, 1991
72.294
+1.133
1.59%
jan 1, 1992
72.438
+0.144
0.2%
jan 1, 1993
74.354
+1.916
2.65%
jan 1, 1994
71.848
-2.506
-3.37%
jan 1, 1995
62.126
-9.722
-13.53%
jan 1, 1996
62.002
-0.124
-0.2%
jan 1, 1997
63.932
+1.93
3.11%
jan 1, 1998
68.854
+4.921
7.7%
jan 1, 1999
67.697
-1.157
-1.68%
jan 1, 2000
68.648
+0.951
1.41%
jan 1, 2001
64.179
-4.469
-6.51%
jan 1, 2002
56.788
-7.39
-11.52%
jan 1, 2003
63.326
+6.537
11.51%
jan 1, 2004
53.263
-10.063
-15.89%
jan 1, 2005
57.41
+4.147
7.79%
jan 1, 2006
49.912
-7.498
-13.06%
jan 1, 2007
48.828
-1.084
-2.17%
jan 1, 2008
46.987
-1.841
-3.77%
jan 1, 2009
46.952
-0.035
-0.07%
jan 1, 2010
44.827
-2.124
-4.52%
jan 1, 2011
41.507
-3.321
-7.41%
jan 1, 2012
39.886
-1.62
-3.9%
jan 1, 2013
35.037
-4.849
-12.16%
jan 1, 2014
34.922
-0.115
-0.33%
jan 1, 2015
34.621
-0.301
-0.86%
Ranking of countries by current statistics by years


Comments: