29
/
en
AIzaSyAYiBZKx7MnpbEhh9jyipgxe19OcubqV5w
April 1, 2024
141370
Gibraltar
GIB
true
2
1
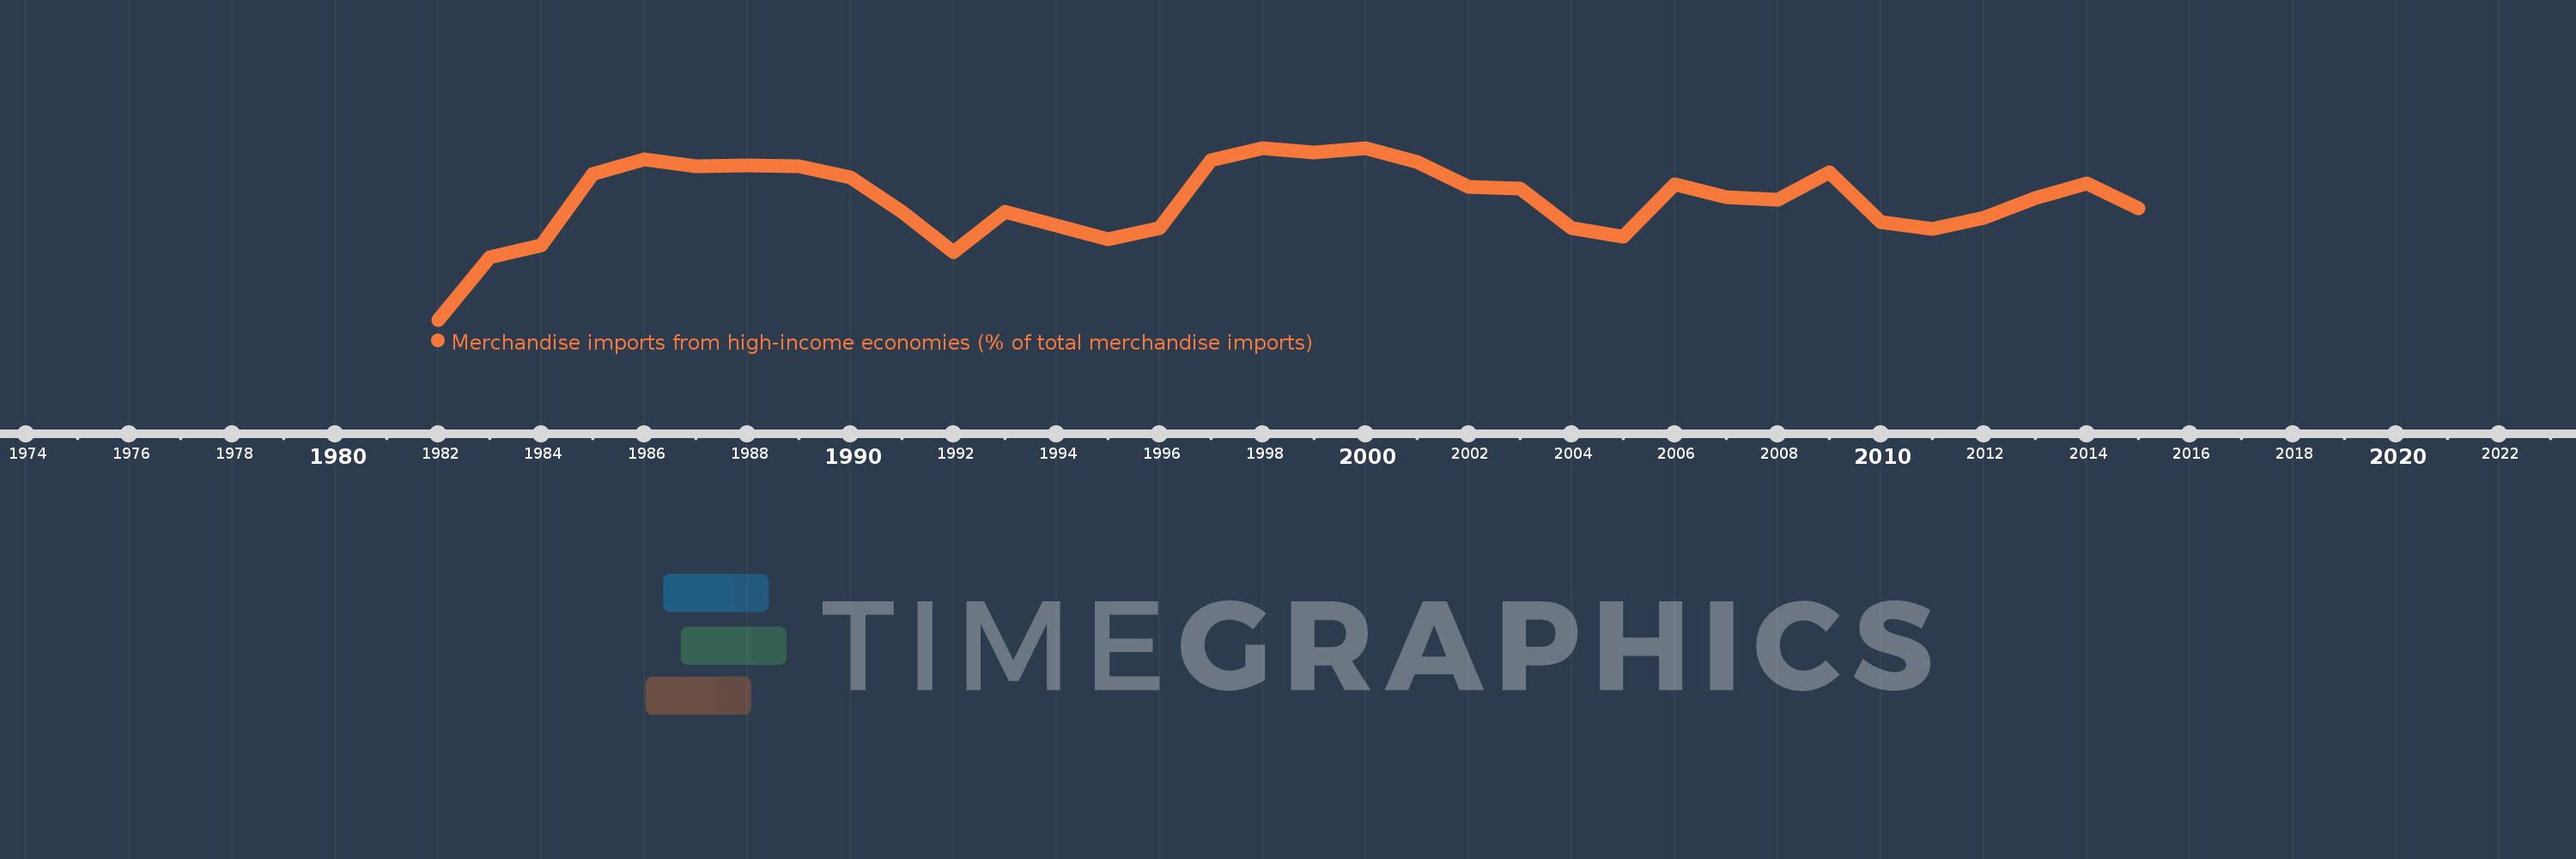
Merchandise imports from high-income economies (% of total merchandise imports)
2015,2014,2013,2012,2011,2010,2009,2008,2007,2006,2005,2004,2003,2002,2001,2000,1999,1998,1997,1996,1995,1994,1993,1992,1991,1990,1989,1988,1987,1986,1985,1984,1983,1982
This statistics in other country:
AfghanistanAlbaniaAlgeriaAngolaAntigua and BarbudaArab WorldArgentinaArmeniaArubaAustraliaAustriaAzerbaijanBahamas, TheBahrainBangladeshBarbadosBelarusBelgiumBelizeBeninBermudaBoliviaBosnia and HerzegovinaBrazilBrunei DarussalamBulgariaBurkina FasoBurundiCabo VerdeCambodiaCameroonCanadaCaribbean small statesCentral African RepublicCentral Europe and the BalticsChadChileChinaColombiaComorosCongo, Dem. Rep.Congo, Rep.Costa RicaCote d'IvoireCroatiaCubaCyprusCzech RepublicDenmarkDjiboutiDominicaDominican RepublicEarly-demographic dividendEast Asia & PacificEast Asia & Pacific (excluding high income)East Asia & Pacific (IDA & IBRD countries)EcuadorEgypt, Arab Rep.El SalvadorEquatorial GuineaEstoniaEthiopiaEuro areaEurope & Central AsiaEurope & Central Asia (excluding high income)Europe & Central Asia (IDA & IBRD countries)European UnionFaroe IslandsFijiFinlandFragile and conflict affected situationsFranceFrench PolynesiaGabonGambia, TheGeorgiaGermanyGhanaGibraltarGreeceGreenlandGrenadaGuamGuatemalaGuineaGuinea-BissauGuyanaHaitiHeavily indebted poor countries (HIPC)High incomeHondurasHong Kong SAR, ChinaHungaryIBRD onlyIcelandIDA & IBRD totalIDA blendIDA onlyIDA totalIndiaIndonesiaIran, Islamic Rep.IraqIrelandIsraelItalyJamaicaJapanJordanKazakhstanKenyaKiribatiKorea, Dem. People’s Rep.Korea, Rep.KosovoKuwaitKyrgyz RepublicLao PDRLate-demographic dividendLatin America & Caribbean Latin America & Caribbean (excluding high income)Latin America & the Caribbean (IDA & IBRD countries)LatviaLeast developed countries: UN classificationLebanonLiberiaLibyaLithuaniaLow & middle incomeLow incomeLower middle incomeLuxembourgMacao SAR, ChinaMacedonia, FYRMadagascarMalawiMalaysiaMaldivesMaliMaltaMauritaniaMauritiusMexicoMiddle East & North AfricaMiddle East & North Africa (excluding high income)Middle East & North Africa (IDA & IBRD countries)Middle incomeMoldovaMongoliaMontenegroMoroccoMozambiqueMyanmarNauruNepalNetherlandsNew CaledoniaNew ZealandNicaraguaNigerNigeriaNorth AmericaNorwayOECD membersOmanOther small statesPacific island small statesPakistanPanamaPapua New GuineaParaguayPeruPhilippinesPolandPortugalPost-demographic dividendPre-demographic dividendQatarRomaniaRussian FederationRwandaSamoaSao Tome and PrincipeSaudi ArabiaSenegalSerbiaSeychellesSierra LeoneSingaporeSlovak RepublicSloveniaSmall statesSolomon IslandsSomaliaSouth AfricaSouth AsiaSouth Asia (IDA & IBRD)SpainSri LankaSt. Kitts and NevisSt. LuciaSt. Vincent and the GrenadinesSub-Saharan Africa Sub-Saharan Africa (excluding high income)Sub-Saharan Africa (IDA & IBRD countries)SudanSurinameSwedenSwitzerlandSyrian Arab RepublicTajikistanTanzaniaThailandTogoTongaTrinidad and TobagoTunisiaTurkeyTurkmenistanTuvaluUgandaUkraineUnited Arab EmiratesUnited KingdomUnited StatesUpper middle incomeUruguayUzbekistanVanuatuVenezuela, RBVietnamWorldYemen, Rep.ZambiaZimbabwe Timeline:
This timeline shows a graph from 1982 to 2015 of Gibraltar. No data until 1981. Number of actual observations by date: 34.
Source name:
World Development Indicators
Source organization:
World Bank staff estimates based data from International Monetary Fund's Direction of Trade database.
Categories, topics:
Private Sector, Trade
Last updated:
apr 23, 2017
Indicators value changes by year
Minimum:
76.619
jan 1, 1982
Maximum:
97.942
jan 1, 2000
At the date of observation
Value
Absolute change
Change from previous value
jan 1, 1982
76.619
+76.619
0.0%
jan 1, 1983
84.345
+7.726
10.08%
jan 1, 1984
85.888
+1.543
1.83%
jan 1, 1985
94.727
+8.84
10.29%
jan 1, 1986
96.534
+1.807
1.91%
jan 1, 1987
95.703
-0.831
-0.86%
jan 1, 1988
95.793
+0.09
0.09%
jan 1, 1989
95.645
-0.148
-0.15%
jan 1, 1990
94.274
-1.371
-1.43%
jan 1, 1991
89.972
-4.302
-4.56%
jan 1, 1992
84.978
-4.994
-5.55%
jan 1, 1993
90.014
+5.036
5.93%
jan 1, 1994
88.364
-1.65
-1.83%
jan 1, 1995
86.57
-1.794
-2.03%
jan 1, 1996
88.022
+1.453
1.68%
jan 1, 1997
96.418
+8.396
9.54%
jan 1, 1998
97.906
+1.488
1.54%
jan 1, 1999
97.406
-0.5
-0.51%
jan 1, 2000
97.942
+0.536
0.55%
jan 1, 2001
96.226
-1.717
-1.75%
jan 1, 2002
93.097
-3.129
-3.25%
jan 1, 2003
92.87
-0.226
-0.24%
jan 1, 2004
87.978
-4.893
-5.27%
jan 1, 2005
86.908
-1.07
-1.22%
jan 1, 2006
93.428
+6.521
7.5%
jan 1, 2007
91.836
-1.592
-1.7%
jan 1, 2008
91.498
-0.338
-0.37%
jan 1, 2009
94.877
+3.379
3.69%
jan 1, 2010
88.694
-6.183
-6.52%
jan 1, 2011
87.908
-0.786
-0.89%
jan 1, 2012
89.277
+1.369
1.56%
jan 1, 2013
91.73
+2.453
2.75%
jan 1, 2014
93.588
+1.858
2.03%
jan 1, 2015
90.474
-3.115
-3.33%
Ranking of countries by current statistics by years


Comments: