29
/
en
AIzaSyAYiBZKx7MnpbEhh9jyipgxe19OcubqV5w
April 1, 2024
264878
Togo
TGO
true
2
1
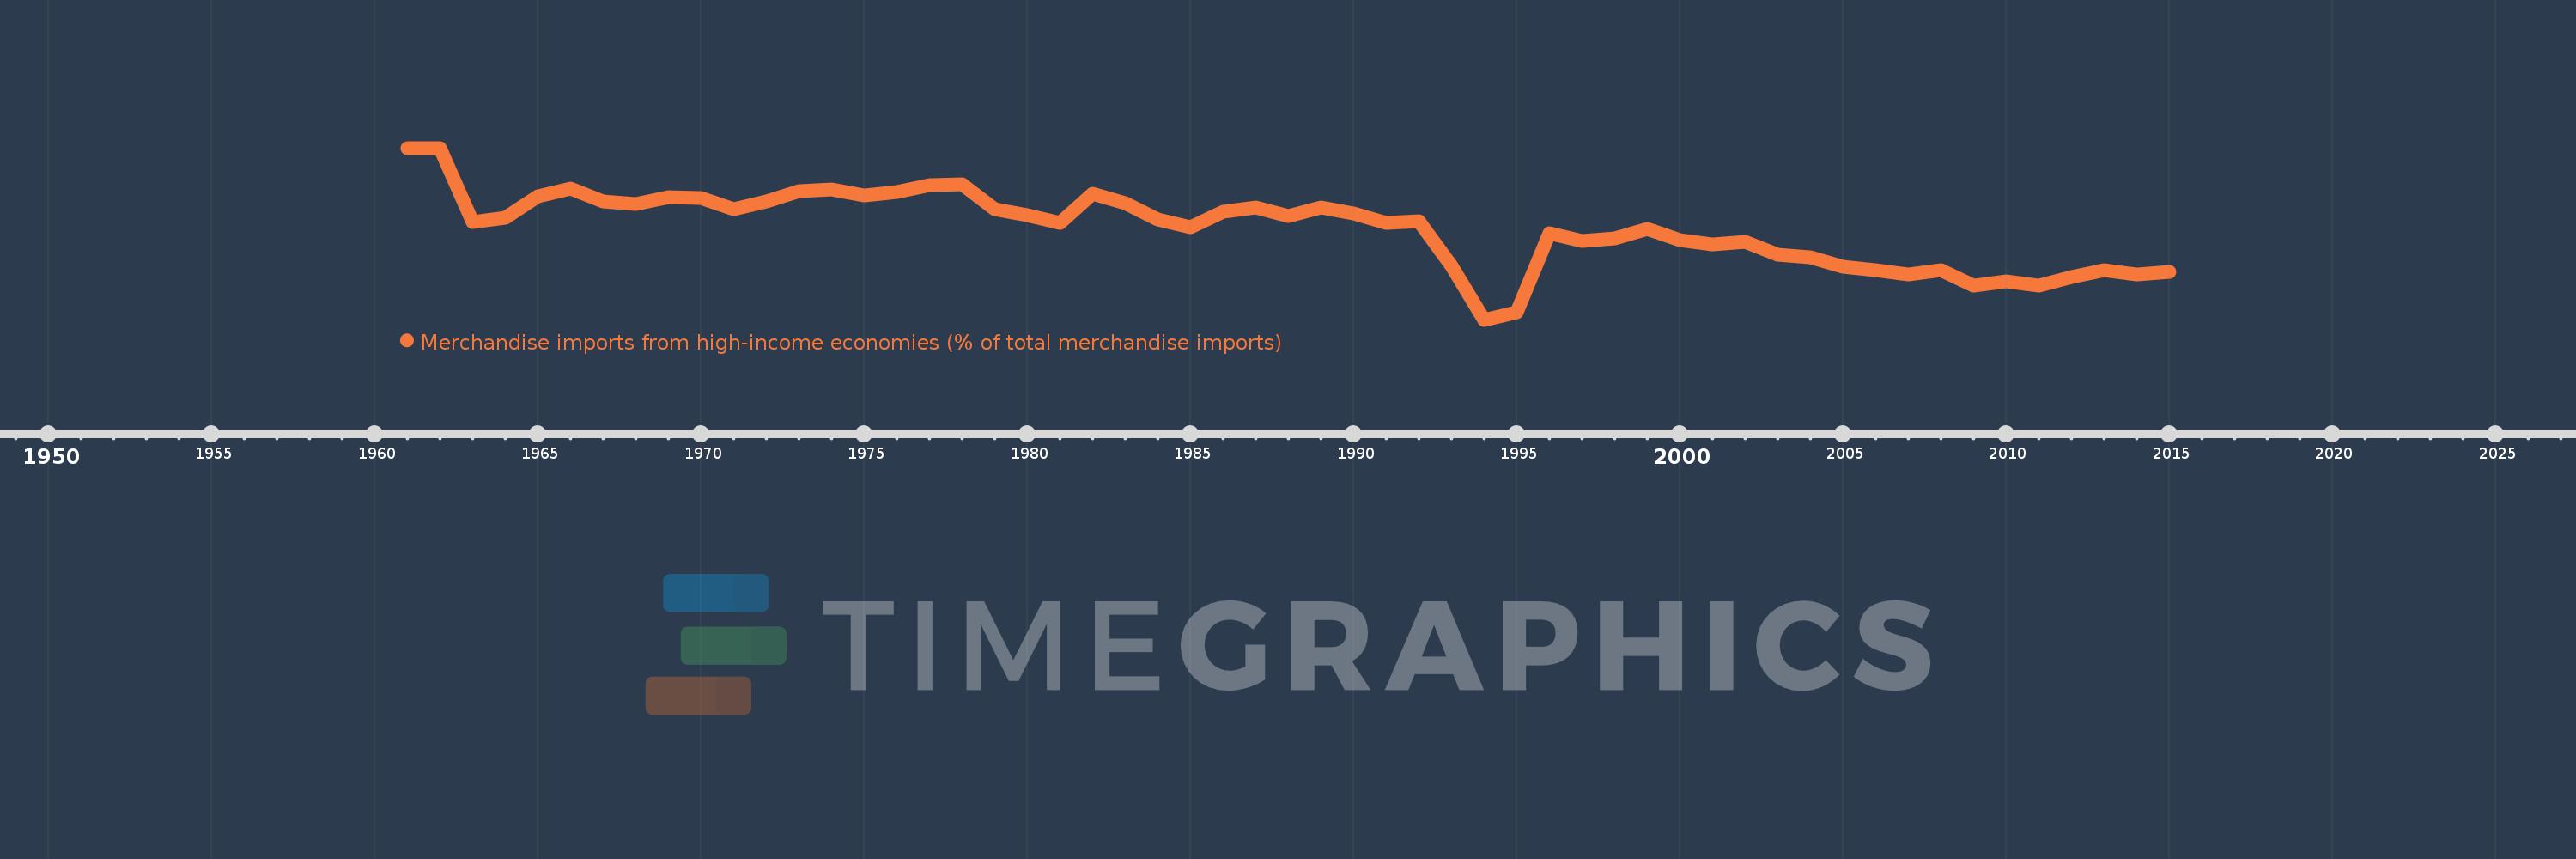
Merchandise imports from high-income economies (% of total merchandise imports)
2015,2014,2013,2012,2011,2010,2009,2008,2007,2006,2005,2004,2003,2002,2001,2000,1999,1998,1997,1996,1995,1994,1993,1992,1991,1990,1989,1988,1987,1986,1985,1984,1983,1982,1981,1980,1979,1978,1977,1976,1975,1974,1973,1972,1971,1970,1969,1968,1967,1966,1965,1964,1963,1962,1961
This statistics in other country:
AfghanistanAlbaniaAlgeriaAngolaAntigua and BarbudaArab WorldArgentinaArmeniaArubaAustraliaAustriaAzerbaijanBahamas, TheBahrainBangladeshBarbadosBelarusBelgiumBelizeBeninBermudaBoliviaBosnia and HerzegovinaBrazilBrunei DarussalamBulgariaBurkina FasoBurundiCabo VerdeCambodiaCameroonCanadaCaribbean small statesCentral African RepublicCentral Europe and the BalticsChadChileChinaColombiaComorosCongo, Dem. Rep.Congo, Rep.Costa RicaCote d'IvoireCroatiaCubaCyprusCzech RepublicDenmarkDjiboutiDominicaDominican RepublicEarly-demographic dividendEast Asia & PacificEast Asia & Pacific (excluding high income)East Asia & Pacific (IDA & IBRD countries)EcuadorEgypt, Arab Rep.El SalvadorEquatorial GuineaEstoniaEthiopiaEuro areaEurope & Central AsiaEurope & Central Asia (excluding high income)Europe & Central Asia (IDA & IBRD countries)European UnionFaroe IslandsFijiFinlandFragile and conflict affected situationsFranceFrench PolynesiaGabonGambia, TheGeorgiaGermanyGhanaGibraltarGreeceGreenlandGrenadaGuamGuatemalaGuineaGuinea-BissauGuyanaHaitiHeavily indebted poor countries (HIPC)High incomeHondurasHong Kong SAR, ChinaHungaryIBRD onlyIcelandIDA & IBRD totalIDA blendIDA onlyIDA totalIndiaIndonesiaIran, Islamic Rep.IraqIrelandIsraelItalyJamaicaJapanJordanKazakhstanKenyaKiribatiKorea, Dem. People’s Rep.Korea, Rep.KosovoKuwaitKyrgyz RepublicLao PDRLate-demographic dividendLatin America & Caribbean Latin America & Caribbean (excluding high income)Latin America & the Caribbean (IDA & IBRD countries)LatviaLeast developed countries: UN classificationLebanonLiberiaLibyaLithuaniaLow & middle incomeLow incomeLower middle incomeLuxembourgMacao SAR, ChinaMacedonia, FYRMadagascarMalawiMalaysiaMaldivesMaliMaltaMauritaniaMauritiusMexicoMiddle East & North AfricaMiddle East & North Africa (excluding high income)Middle East & North Africa (IDA & IBRD countries)Middle incomeMoldovaMongoliaMontenegroMoroccoMozambiqueMyanmarNauruNepalNetherlandsNew CaledoniaNew ZealandNicaraguaNigerNigeriaNorth AmericaNorwayOECD membersOmanOther small statesPacific island small statesPakistanPanamaPapua New GuineaParaguayPeruPhilippinesPolandPortugalPost-demographic dividendPre-demographic dividendQatarRomaniaRussian FederationRwandaSamoaSao Tome and PrincipeSaudi ArabiaSenegalSerbiaSeychellesSierra LeoneSingaporeSlovak RepublicSloveniaSmall statesSolomon IslandsSomaliaSouth AfricaSouth AsiaSouth Asia (IDA & IBRD)SpainSri LankaSt. Kitts and NevisSt. LuciaSt. Vincent and the GrenadinesSub-Saharan Africa Sub-Saharan Africa (excluding high income)Sub-Saharan Africa (IDA & IBRD countries)SudanSurinameSwedenSwitzerlandSyrian Arab RepublicTajikistanTanzaniaThailandTogoTongaTrinidad and TobagoTunisiaTurkeyTurkmenistanTuvaluUgandaUkraineUnited Arab EmiratesUnited KingdomUnited StatesUpper middle incomeUruguayUzbekistanVanuatuVenezuela, RBVietnamWorldYemen, Rep.ZambiaZimbabwe Timeline:
This timeline shows a graph from 1961 to 2015 of Togo. No data until 1960. Number of actual observations by date: 55.
Source name:
World Development Indicators
Source organization:
World Bank staff estimates based data from International Monetary Fund's Direction of Trade database.
Categories, topics:
Private Sector, Trade
Last updated:
apr 23, 2017
Indicators value changes by year
Minimum:
38.461
jan 1, 1994
At the date of observation
Value
Absolute change
Change from previous value
jan 1, 1961
100.0
+100.0
0.0%
jan 1, 1962
100.0
0.0
0.0%
jan 1, 1963
73.432
-26.568
-26.57%
jan 1, 1964
74.913
+1.481
2.02%
jan 1, 1965
82.809
+7.896
10.54%
jan 1, 1966
85.523
+2.715
3.28%
jan 1, 1967
80.892
-4.632
-5.42%
jan 1, 1968
79.955
-0.936
-1.16%
jan 1, 1969
82.468
+2.512
3.14%
jan 1, 1970
81.932
-0.535
-0.65%
jan 1, 1971
77.935
-3.998
-4.88%
jan 1, 1972
80.808
+2.873
3.69%
jan 1, 1973
84.637
+3.829
4.74%
jan 1, 1974
85.225
+0.588
0.69%
jan 1, 1975
82.911
-2.314
-2.72%
jan 1, 1976
84.328
+1.416
1.71%
jan 1, 1977
86.687
+2.359
2.8%
jan 1, 1978
86.914
+0.227
0.26%
jan 1, 1979
77.984
-8.93
-10.27%
jan 1, 1980
75.839
-2.145
-2.75%
jan 1, 1981
73.102
-2.737
-3.61%
jan 1, 1982
83.747
+10.644
14.56%
jan 1, 1983
80.368
-3.378
-4.03%
jan 1, 1984
74.286
-6.083
-7.57%
jan 1, 1985
71.746
-2.54
-3.42%
jan 1, 1986
77.093
+5.347
7.45%
jan 1, 1987
78.802
+1.709
2.22%
jan 1, 1988
75.668
-3.134
-3.98%
jan 1, 1989
78.681
+3.012
3.98%
jan 1, 1990
76.647
-2.034
-2.59%
jan 1, 1991
73.144
-3.503
-4.57%
jan 1, 1992
73.854
+0.71
0.97%
jan 1, 1993
57.731
-16.123
-21.83%
jan 1, 1994
38.461
-19.27
-33.38%
jan 1, 1995
40.996
+2.535
6.59%
jan 1, 1996
69.449
+28.453
69.4%
jan 1, 1997
66.723
-2.726
-3.93%
jan 1, 1998
67.509
+0.786
1.18%
jan 1, 1999
71.063
+3.555
5.27%
jan 1, 2000
66.967
-4.096
-5.76%
jan 1, 2001
65.463
-1.504
-2.25%
jan 1, 2002
66.285
+0.821
1.25%
jan 1, 2003
61.608
-4.676
-7.05%
jan 1, 2004
60.914
-0.694
-1.13%
jan 1, 2005
57.34
-3.575
-5.87%
jan 1, 2006
56.134
-1.206
-2.1%
jan 1, 2007
54.711
-1.423
-2.53%
jan 1, 2008
56.233
+1.523
2.78%
jan 1, 2009
50.703
-5.53
-9.83%
jan 1, 2010
52.267
+1.564
3.08%
jan 1, 2011
50.739
-1.528
-2.92%
jan 1, 2012
53.647
+2.908
5.73%
jan 1, 2013
56.235
+2.589
4.83%
jan 1, 2014
54.563
-1.673
-2.97%
jan 1, 2015
55.73
+1.168
2.14%
Ranking of countries by current statistics by years


Comments: