29
/
en
AIzaSyAYiBZKx7MnpbEhh9jyipgxe19OcubqV5w
April 1, 2024
95019
Burkina Faso
BFA
true
2
1
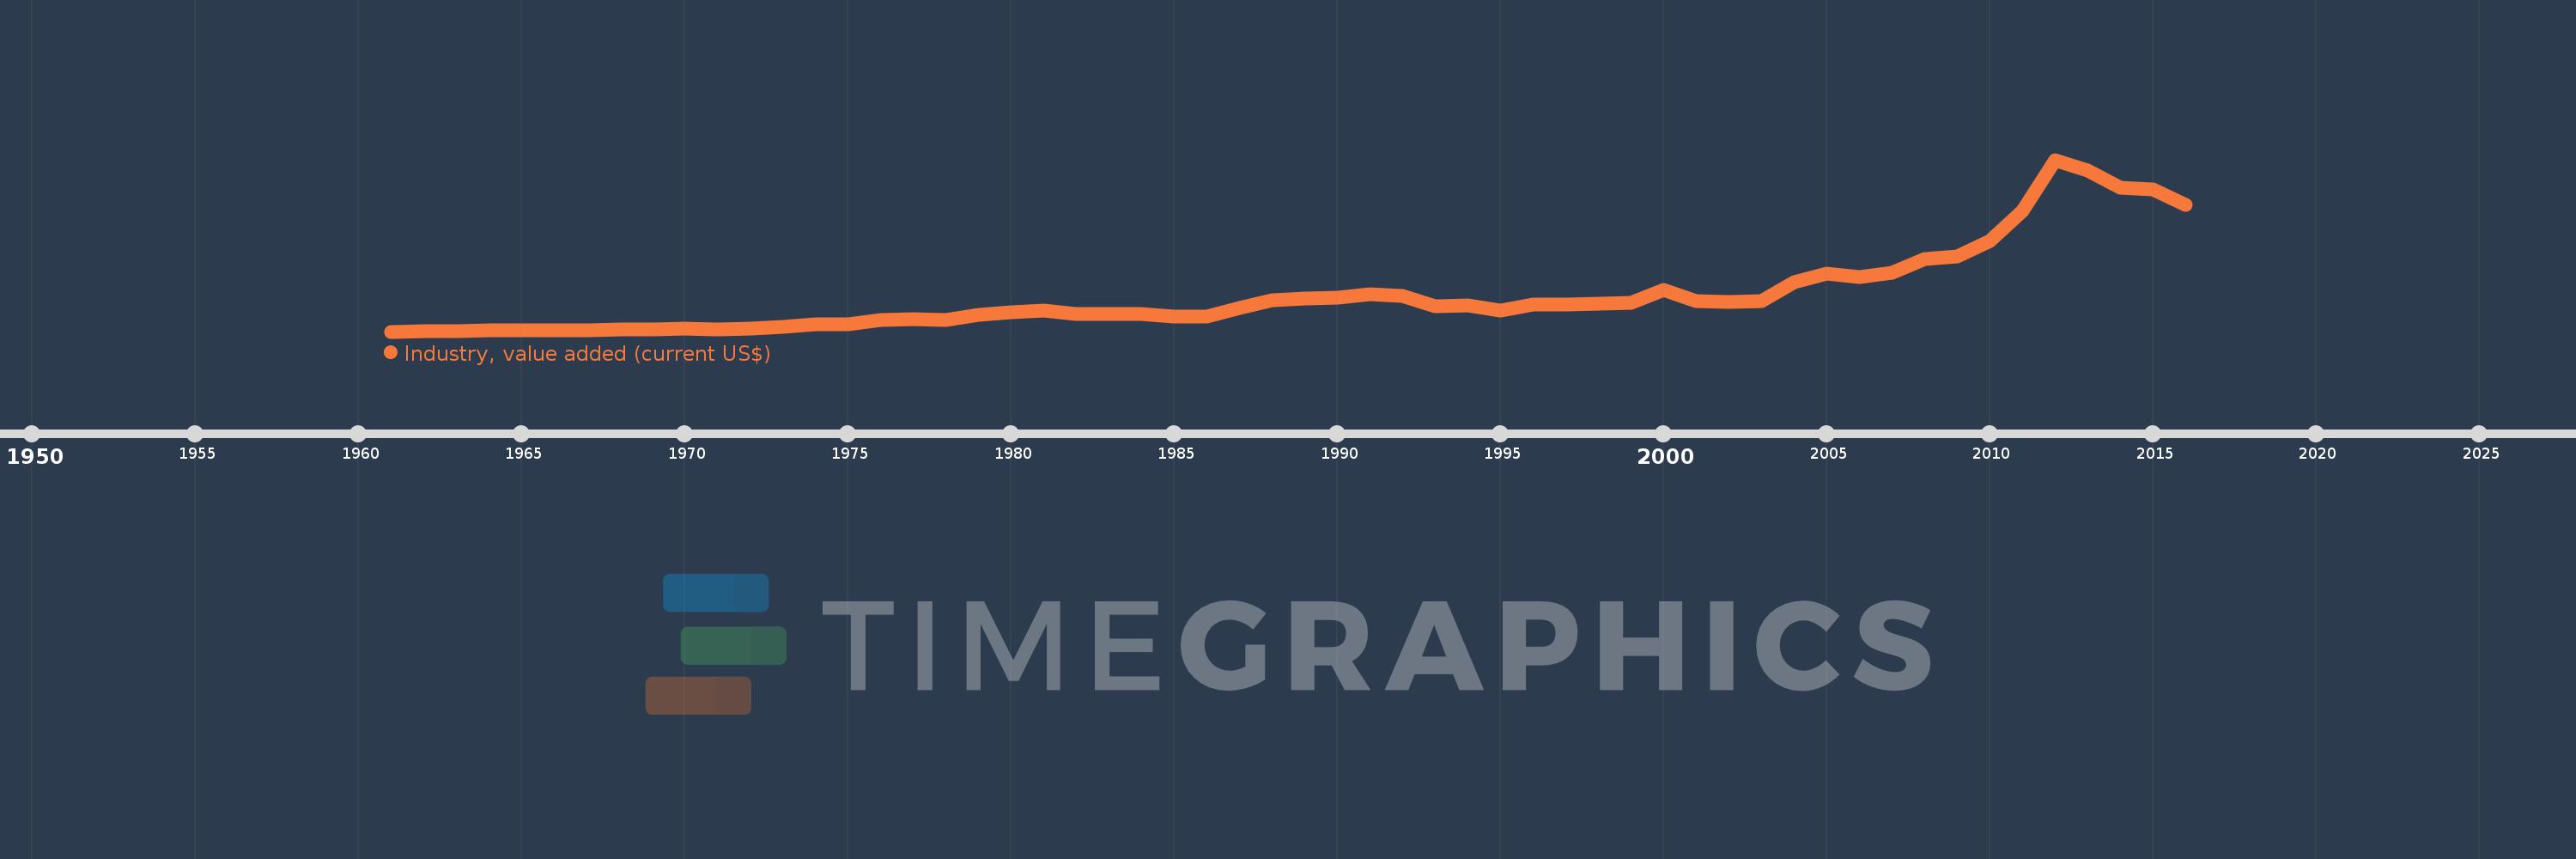
Industry, value added (current US$)
2016,2015,2014,2013,2012,2011,2010,2009,2008,2007,2006,2005,2004,2003,2002,2001,2000,1999,1998,1997,1996,1995,1994,1993,1992,1991,1990,1989,1988,1987,1986,1985,1984,1983,1982,1981,1980,1979,1978,1977,1976,1975,1974,1973,1972,1971,1970,1969,1968,1967,1966,1965,1964,1963,1962,1961
This statistics in other country:
AfghanistanAlbaniaAlgeriaAndorraAngolaAntigua and BarbudaArab WorldArgentinaArmeniaArubaAustraliaAustriaAzerbaijanBahamas, TheBahrainBangladeshBarbadosBelarusBelgiumBelizeBeninBermudaBhutanBoliviaBosnia and HerzegovinaBotswanaBrazilBrunei DarussalamBulgariaBurkina FasoBurundiCabo VerdeCambodiaCameroonCanadaCaribbean small statesCayman IslandsCentral African RepublicCentral Europe and the BalticsChadChileChinaColombiaComorosCongo, Dem. Rep.Congo, Rep.Costa RicaCote d'IvoireCroatiaCubaCyprusCzech RepublicDenmarkDjiboutiDominicaDominican RepublicEarly-demographic dividendEast Asia & PacificEast Asia & Pacific (excluding high income)East Asia & Pacific (IDA & IBRD countries)EcuadorEgypt, Arab Rep.El SalvadorEquatorial GuineaEritreaEstoniaEthiopiaEuro areaEurope & Central AsiaEurope & Central Asia (excluding high income)Europe & Central Asia (IDA & IBRD countries)European UnionFijiFinlandFragile and conflict affected situationsFranceGabonGambia, TheGeorgiaGermanyGhanaGreeceGrenadaGuatemalaGuineaGuinea-BissauGuyanaHeavily indebted poor countries (HIPC)High incomeHondurasHong Kong SAR, ChinaHungaryIBRD onlyIcelandIDA & IBRD totalIDA blendIDA onlyIDA totalIndiaIndonesiaIran, Islamic Rep.IraqIrelandItalyJamaicaJapanJordanKazakhstanKenyaKiribatiKorea, Rep.KosovoKuwaitKyrgyz RepublicLao PDRLate-demographic dividendLatin America & Caribbean Latin America & Caribbean (excluding high income)Latin America & the Caribbean (IDA & IBRD countries)LatviaLeast developed countries: UN classificationLebanonLesothoLiberiaLibyaLiechtensteinLithuaniaLow & middle incomeLow incomeLower middle incomeLuxembourgMacao SAR, ChinaMacedonia, FYRMadagascarMalawiMalaysiaMaldivesMaliMaltaMarshall IslandsMauritaniaMauritiusMexicoMicronesia, Fed. Sts.Middle East & North AfricaMiddle East & North Africa (excluding high income)Middle East & North Africa (IDA & IBRD countries)Middle incomeMoldovaMongoliaMontenegroMoroccoMozambiqueMyanmarNamibiaNepalNetherlandsNew CaledoniaNew ZealandNicaraguaNigerNigeriaNorth AmericaNorwayOECD membersOmanOther small statesPacific island small statesPakistanPalauPanamaPapua New GuineaParaguayPeruPhilippinesPolandPortugalPost-demographic dividendPre-demographic dividendPuerto RicoQatarRomaniaRussian FederationRwandaSamoaSao Tome and PrincipeSaudi ArabiaSenegalSerbiaSeychellesSierra LeoneSingaporeSlovak RepublicSloveniaSmall statesSolomon IslandsSouth AfricaSouth AsiaSouth Asia (IDA & IBRD)SpainSri LankaSt. Kitts and NevisSt. LuciaSt. Vincent and the GrenadinesSub-Saharan Africa Sub-Saharan Africa (excluding high income)Sub-Saharan Africa (IDA & IBRD countries)SudanSurinameSwazilandSwedenSwitzerlandSyrian Arab RepublicTajikistanTanzaniaThailandTimor-LesteTogoTongaTrinidad and TobagoTunisiaTurkeyTurkmenistanTuvaluUgandaUkraineUnited Arab EmiratesUnited KingdomUnited StatesUpper middle incomeUruguayUzbekistanVanuatuVenezuela, RBVietnamWest Bank and GazaWorldYemen, Rep.ZambiaZimbabwe Timeline:
This timeline shows a graph from 1961 to 2016 of Burkina Faso. No data until 1960. Number of actual observations by date: 56.
Source name:
World Development Indicators
Source organization:
World Bank national accounts data, and OECD National Accounts data files.
Categories, topics:
Economy & Growth
Last updated:
apr 23, 2017
Indicators value changes by year
Minimum:
65.804 mln
jan 1, 1961
Maximum:
2.655 bln
jan 1, 2012
At the date of observation
Value
Absolute change
Change from previous value
jan 1, 1961
65.804 mln
+65.804 mln
0.0%
jan 1, 1962
69.68 mln
+3.876 mln
5.89%
jan 1, 1963
73.513 mln
+3.833 mln
5.5%
jan 1, 1964
81.266 mln
+7.752 mln
10.55%
jan 1, 1965
82.399 mln
+1.133 mln
1.39%
jan 1, 1966
79.07 mln
-3.329 mln
-4.04%
jan 1, 1967
82.533 mln
+3.463 mln
4.38%
jan 1, 1968
99.564 mln
+17.031 mln
20.64%
jan 1, 1969
104.608 mln
+5.045 mln
5.07%
jan 1, 1970
107.351 mln
+2.742 mln
2.62%
jan 1, 1971
101.998 mln
-5.353 mln
-4.99%
jan 1, 1972
116.956 mln
+14.959 mln
14.67%
jan 1, 1973
134.895 mln
+17.939 mln
15.34%
jan 1, 1974
176.794 mln
+41.899 mln
31.06%
jan 1, 1975
172.592 mln
-4.202 mln
-2.38%
jan 1, 1976
243.836 mln
+71.244 mln
41.28%
jan 1, 1977
258.465 mln
+14.629 mln
6.0%
jan 1, 1978
240.986 mln
-17.479 mln
-6.76%
jan 1, 1979
316.521 mln
+75.535 mln
31.34%
jan 1, 1980
361.236 mln
+44.716 mln
14.13%
jan 1, 1981
382.097 mln
+20.861 mln
5.77%
jan 1, 1982
333.252 mln
-48.845 mln
-12.78%
jan 1, 1983
330.618 mln
-2.634 mln
-0.79%
jan 1, 1984
325.774 mln
-4.844 mln
-1.47%
jan 1, 1985
291.482 mln
-34.292 mln
-10.53%
jan 1, 1986
298.538 mln
+7.056 mln
2.42%
jan 1, 1987
422.115 mln
+123.577 mln
41.39%
jan 1, 1988
534.348 mln
+112.233 mln
26.59%
jan 1, 1989
562.773 mln
+28.426 mln
5.32%
jan 1, 1990
578.731 mln
+15.958 mln
2.84%
jan 1, 1991
631.709 mln
+52.978 mln
9.15%
jan 1, 1992
603.668 mln
-28.04 mln
-4.44%
jan 1, 1993
453.87 mln
-149.798 mln
-24.81%
jan 1, 1994
462.978 mln
+9.108 mln
2.01%
jan 1, 1995
386.852 mln
-76.126 mln
-16.44%
jan 1, 1996
474.592 mln
+87.741 mln
22.68%
jan 1, 1997
478.311 mln
+3.718 mln
0.78%
jan 1, 1998
481.77 mln
+3.459 mln
0.72%
jan 1, 1999
500.842 mln
+19.072 mln
3.96%
jan 1, 2000
694.182 mln
+193.341 mln
38.6%
jan 1, 2001
531.107 mln
-163.076 mln
-23.49%
jan 1, 2002
510.247 mln
-20.86 mln
-3.93%
jan 1, 2003
521.636 mln
+11.39 mln
2.23%
jan 1, 2004
804.656 mln
+283.02 mln
54.26%
jan 1, 2005
938.617 mln
+133.96 mln
16.65%
jan 1, 2006
887.422 mln
-51.195 mln
-5.45%
jan 1, 2007
947.655 mln
+60.233 mln
6.79%
jan 1, 2008
1.165 bln
+216.865 mln
22.88%
jan 1, 2009
1.196 bln
+31.159 mln
2.68%
jan 1, 2010
1.434 bln
+238.123 mln
19.92%
jan 1, 2011
1.889 bln
+455.22 mln
31.75%
jan 1, 2012
2.655 bln
+765.514 mln
40.52%
jan 1, 2013
2.498 bln
-156.211 mln
-5.88%
jan 1, 2014
2.23 bln
-268.319 mln
-10.74%
jan 1, 2015
2.214 bln
-16.268 mln
-0.73%
jan 1, 2016
1.973 bln
-241.12 mln
-10.89%
Ranking of countries by current statistics by years


Comments: