29
/
en
AIzaSyAYiBZKx7MnpbEhh9jyipgxe19OcubqV5w
April 1, 2024
272396
Uganda
UGA
true
2
1
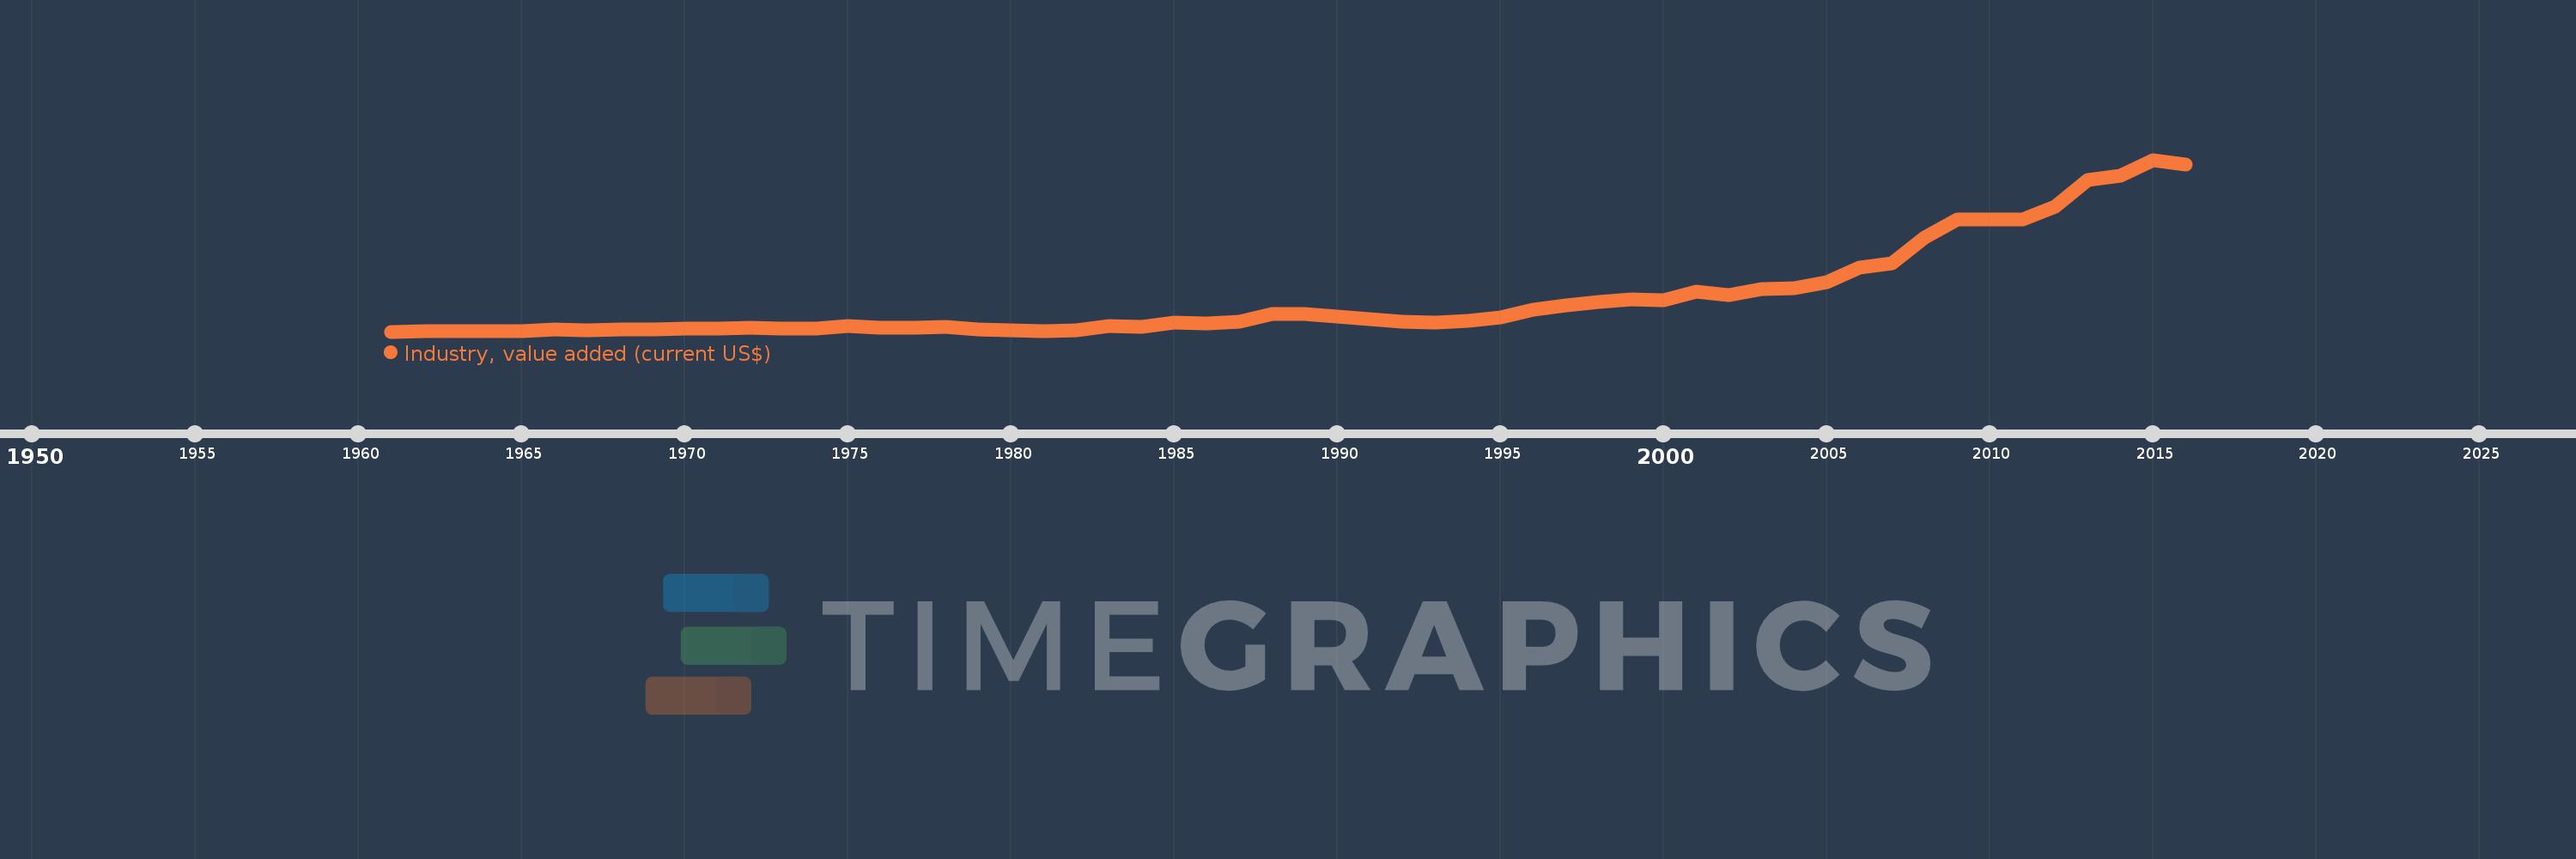
Industry, value added (current US$)
2016,2015,2014,2013,2012,2011,2010,2009,2008,2007,2006,2005,2004,2003,2002,2001,2000,1999,1998,1997,1996,1995,1994,1993,1992,1991,1990,1989,1988,1987,1986,1985,1984,1983,1982,1981,1980,1979,1978,1977,1976,1975,1974,1973,1972,1971,1970,1969,1968,1967,1966,1965,1964,1963,1962,1961
This statistics in other country:
AfghanistanAlbaniaAlgeriaAndorraAngolaAntigua and BarbudaArab WorldArgentinaArmeniaArubaAustraliaAustriaAzerbaijanBahamas, TheBahrainBangladeshBarbadosBelarusBelgiumBelizeBeninBermudaBhutanBoliviaBosnia and HerzegovinaBotswanaBrazilBrunei DarussalamBulgariaBurkina FasoBurundiCabo VerdeCambodiaCameroonCanadaCaribbean small statesCayman IslandsCentral African RepublicCentral Europe and the BalticsChadChileChinaColombiaComorosCongo, Dem. Rep.Congo, Rep.Costa RicaCote d'IvoireCroatiaCubaCyprusCzech RepublicDenmarkDjiboutiDominicaDominican RepublicEarly-demographic dividendEast Asia & PacificEast Asia & Pacific (excluding high income)East Asia & Pacific (IDA & IBRD countries)EcuadorEgypt, Arab Rep.El SalvadorEquatorial GuineaEritreaEstoniaEthiopiaEuro areaEurope & Central AsiaEurope & Central Asia (excluding high income)Europe & Central Asia (IDA & IBRD countries)European UnionFijiFinlandFragile and conflict affected situationsFranceGabonGambia, TheGeorgiaGermanyGhanaGreeceGrenadaGuatemalaGuineaGuinea-BissauGuyanaHeavily indebted poor countries (HIPC)High incomeHondurasHong Kong SAR, ChinaHungaryIBRD onlyIcelandIDA & IBRD totalIDA blendIDA onlyIDA totalIndiaIndonesiaIran, Islamic Rep.IraqIrelandItalyJamaicaJapanJordanKazakhstanKenyaKiribatiKorea, Rep.KosovoKuwaitKyrgyz RepublicLao PDRLate-demographic dividendLatin America & Caribbean Latin America & Caribbean (excluding high income)Latin America & the Caribbean (IDA & IBRD countries)LatviaLeast developed countries: UN classificationLebanonLesothoLiberiaLibyaLiechtensteinLithuaniaLow & middle incomeLow incomeLower middle incomeLuxembourgMacao SAR, ChinaMacedonia, FYRMadagascarMalawiMalaysiaMaldivesMaliMaltaMarshall IslandsMauritaniaMauritiusMexicoMicronesia, Fed. Sts.Middle East & North AfricaMiddle East & North Africa (excluding high income)Middle East & North Africa (IDA & IBRD countries)Middle incomeMoldovaMongoliaMontenegroMoroccoMozambiqueMyanmarNamibiaNepalNetherlandsNew CaledoniaNew ZealandNicaraguaNigerNigeriaNorth AmericaNorwayOECD membersOmanOther small statesPacific island small statesPakistanPalauPanamaPapua New GuineaParaguayPeruPhilippinesPolandPortugalPost-demographic dividendPre-demographic dividendPuerto RicoQatarRomaniaRussian FederationRwandaSamoaSao Tome and PrincipeSaudi ArabiaSenegalSerbiaSeychellesSierra LeoneSingaporeSlovak RepublicSloveniaSmall statesSolomon IslandsSouth AfricaSouth AsiaSouth Asia (IDA & IBRD)SpainSri LankaSt. Kitts and NevisSt. LuciaSt. Vincent and the GrenadinesSub-Saharan Africa Sub-Saharan Africa (excluding high income)Sub-Saharan Africa (IDA & IBRD countries)SudanSurinameSwazilandSwedenSwitzerlandSyrian Arab RepublicTajikistanTanzaniaThailandTimor-LesteTogoTongaTrinidad and TobagoTunisiaTurkeyTurkmenistanTuvaluUgandaUkraineUnited Arab EmiratesUnited KingdomUnited StatesUpper middle incomeUruguayUzbekistanVanuatuVenezuela, RBVietnamWest Bank and GazaWorldYemen, Rep.ZambiaZimbabwe Timeline:
This timeline shows a graph from 1961 to 2016 of Uganda. No data until 1960. Number of actual observations by date: 56.
Source name:
World Development Indicators
Source organization:
World Bank national accounts data, and OECD National Accounts data files.
Categories, topics:
Economy & Growth
Last updated:
apr 23, 2017
Indicators value changes by year
Minimum:
54.213 mln
jan 1, 1961
Maximum:
5.584 bln
jan 1, 2015
At the date of observation
Value
Absolute change
Change from previous value
jan 1, 1961
54.213 mln
+54.213 mln
0.0%
jan 1, 1962
56.642 mln
+2.429 mln
4.48%
jan 1, 1963
54.406 mln
-2.236 mln
-3.95%
jan 1, 1964
69.122 mln
+14.716 mln
27.05%
jan 1, 1965
71.155 mln
+2.034 mln
2.94%
jan 1, 1966
112.045 mln
+40.89 mln
57.47%
jan 1, 1967
108.123 mln
-3.922 mln
-3.5%
jan 1, 1968
111.485 mln
+3.361 mln
3.11%
jan 1, 1969
128.431 mln
+16.947 mln
15.2%
jan 1, 1970
149.72 mln
+21.289 mln
16.58%
jan 1, 1971
163.866 mln
+14.146 mln
9.45%
jan 1, 1972
169.328 mln
+5.462 mln
3.33%
jan 1, 1973
159.524 mln
-9.804 mln
-5.79%
jan 1, 1974
158.123 mln
-1.401 mln
-0.88%
jan 1, 1975
223.823 mln
+65.7 mln
41.55%
jan 1, 1976
188.333 mln
-35.49 mln
-15.86%
jan 1, 1977
181.1 mln
-7.233 mln
-3.84%
jan 1, 1978
204.882 mln
+23.782 mln
13.13%
jan 1, 1979
123.783 mln
-81.1 mln
-39.58%
jan 1, 1980
88.45 mln
-35.333 mln
-28.54%
jan 1, 1981
55.63 mln
-32.82 mln
-37.11%
jan 1, 1982
90.0 mln
+34.37 mln
61.78%
jan 1, 1983
233.0 mln
+143.0 mln
158.89%
jan 1, 1984
195.0 mln
-38.0 mln
-16.31%
jan 1, 1985
356.358 mln
+161.358 mln
82.75%
jan 1, 1986
318.954 mln
-37.404 mln
-10.5%
jan 1, 1987
376.536 mln
+57.582 mln
18.05%
jan 1, 1988
609.436 mln
+232.9 mln
61.85%
jan 1, 1989
634.483 mln
+25.047 mln
4.11%
jan 1, 1990
540.787 mln
-93.697 mln
-14.77%
jan 1, 1991
448.287 mln
-92.499 mln
-17.1%
jan 1, 1992
383.823 mln
-64.464 mln
-14.38%
jan 1, 1993
355.966 mln
-27.857 mln
-7.26%
jan 1, 1994
395.081 mln
+39.115 mln
10.99%
jan 1, 1995
511.708 mln
+116.627 mln
29.52%
jan 1, 1996
754.362 mln
+242.654 mln
47.42%
jan 1, 1997
889.117 mln
+134.755 mln
17.86%
jan 1, 1998
999.123 mln
+110.006 mln
12.37%
jan 1, 1999
1.082 bln
+83.291 mln
8.34%
jan 1, 2000
1.071 bln
-11.861 mln
-1.1%
jan 1, 2001
1.328 bln
+257.166 mln
24.02%
jan 1, 2002
1.236 bln
-91.363 mln
-6.88%
jan 1, 2003
1.416 bln
+179.777 mln
14.54%
jan 1, 2004
1.437 bln
+20.821 mln
1.47%
jan 1, 2005
1.657 bln
+219.724 mln
15.29%
jan 1, 2006
2.119 bln
+462.484 mln
27.92%
jan 1, 2007
2.264 bln
+144.386 mln
6.81%
jan 1, 2008
3.083 bln
+819.162 mln
36.19%
jan 1, 2009
3.669 bln
+586.418 mln
19.02%
jan 1, 2010
3.668 bln
-797.709K
-0.02%
jan 1, 2011
3.659 bln
-9.12 mln
-0.25%
jan 1, 2012
4.072 bln
+413.152 mln
11.29%
jan 1, 2013
4.936 bln
+863.166 mln
21.2%
jan 1, 2014
5.083 bln
+147.528 mln
2.99%
jan 1, 2015
5.584 bln
+500.759 mln
9.85%
jan 1, 2016
5.419 bln
-165.175 mln
-2.96%
Ranking of countries by current statistics by years


Comments: