29
/
en
AIzaSyAYiBZKx7MnpbEhh9jyipgxe19OcubqV5w
April 1, 2024
59896
Sub-Saharan Africa (excluding high income)
SSA
false
2
1
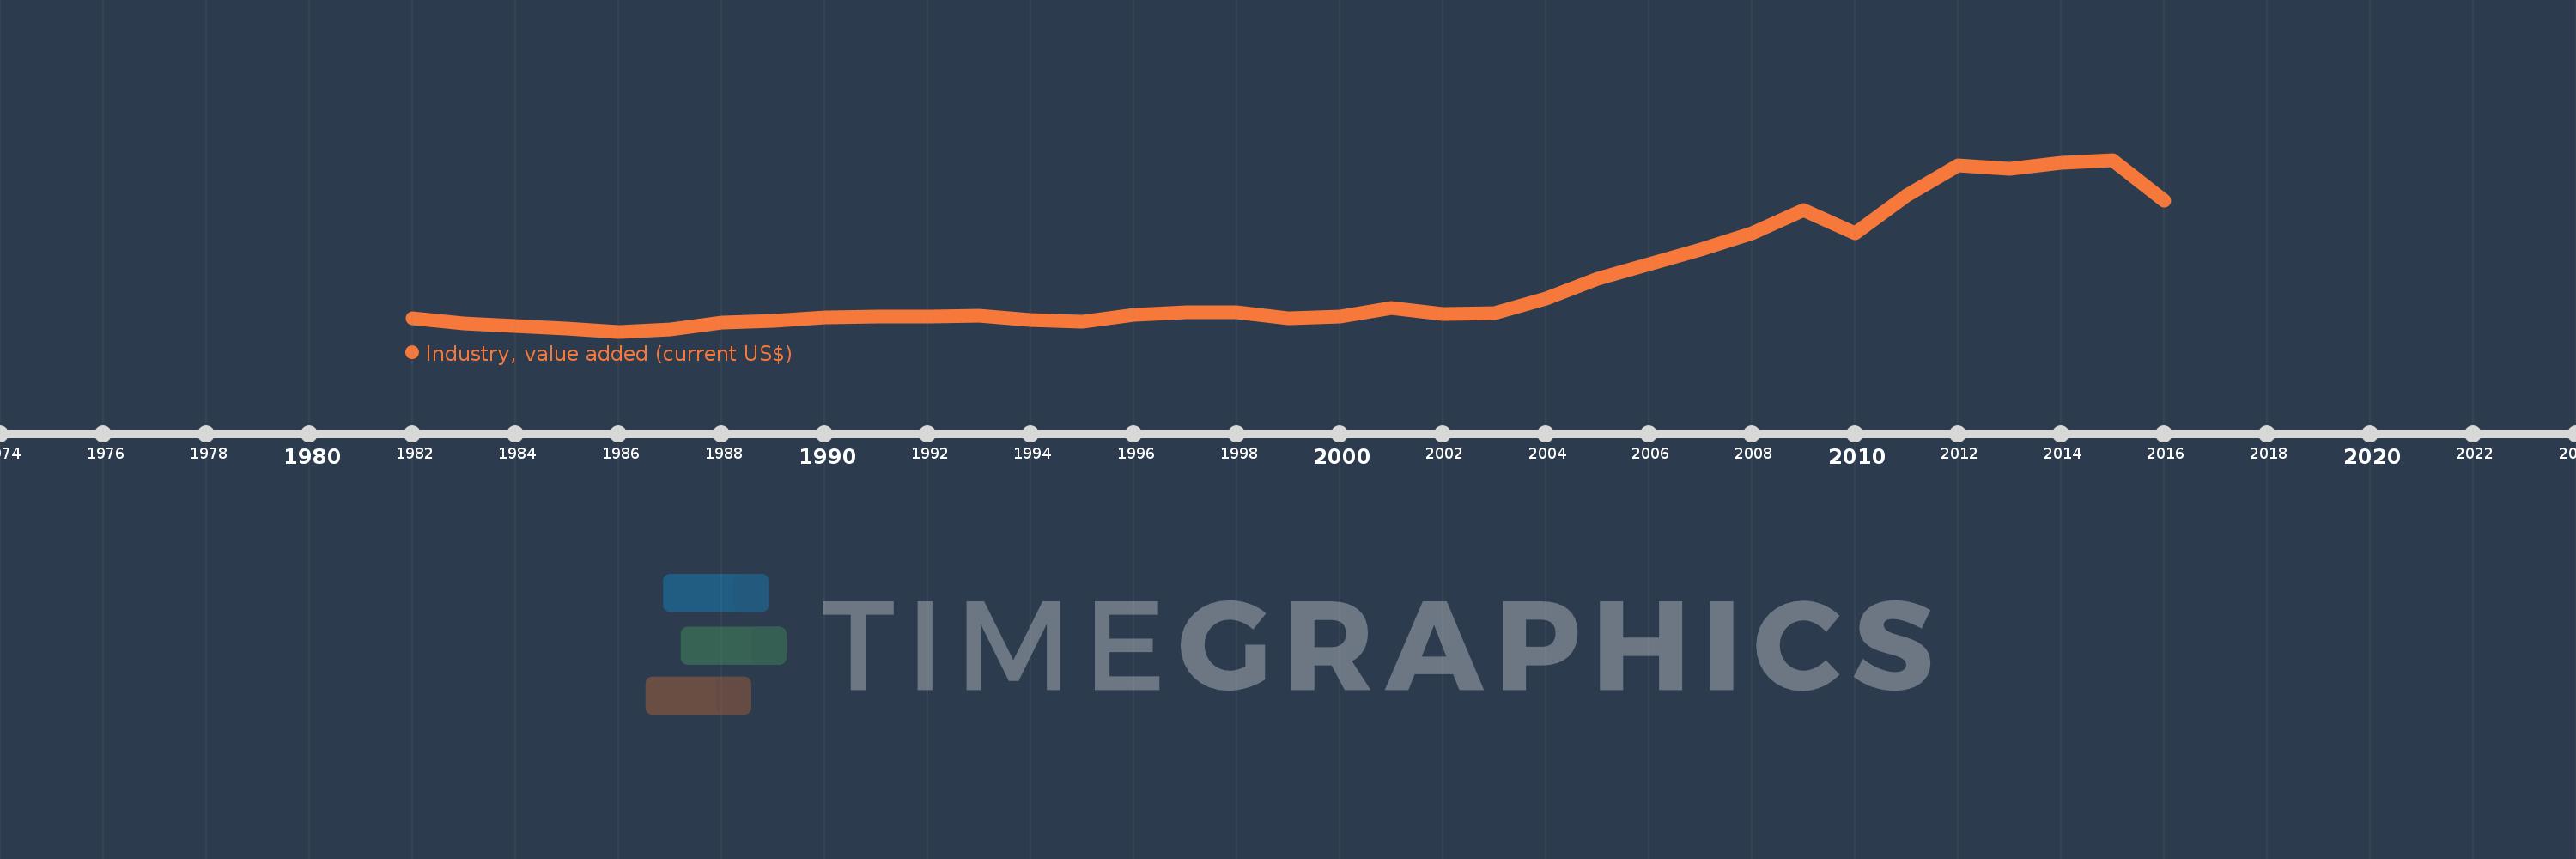
Industry, value added (current US$)
2016,2015,2014,2013,2012,2011,2010,2009,2008,2007,2006,2005,2004,2003,2002,2001,2000,1999,1998,1997,1996,1995,1994,1993,1992,1991,1990,1989,1988,1987,1986,1985,1984,1983,1982
This statistics in other country:
AfghanistanAlbaniaAlgeriaAndorraAngolaAntigua and BarbudaArab WorldArgentinaArmeniaArubaAustraliaAustriaAzerbaijanBahamas, TheBahrainBangladeshBarbadosBelarusBelgiumBelizeBeninBermudaBhutanBoliviaBosnia and HerzegovinaBotswanaBrazilBrunei DarussalamBulgariaBurkina FasoBurundiCabo VerdeCambodiaCameroonCanadaCaribbean small statesCayman IslandsCentral African RepublicCentral Europe and the BalticsChadChileChinaColombiaComorosCongo, Dem. Rep.Congo, Rep.Costa RicaCote d'IvoireCroatiaCubaCyprusCzech RepublicDenmarkDjiboutiDominicaDominican RepublicEarly-demographic dividendEast Asia & PacificEast Asia & Pacific (excluding high income)East Asia & Pacific (IDA & IBRD countries)EcuadorEgypt, Arab Rep.El SalvadorEquatorial GuineaEritreaEstoniaEthiopiaEuro areaEurope & Central AsiaEurope & Central Asia (excluding high income)Europe & Central Asia (IDA & IBRD countries)European UnionFijiFinlandFragile and conflict affected situationsFranceGabonGambia, TheGeorgiaGermanyGhanaGreeceGrenadaGuatemalaGuineaGuinea-BissauGuyanaHeavily indebted poor countries (HIPC)High incomeHondurasHong Kong SAR, ChinaHungaryIBRD onlyIcelandIDA & IBRD totalIDA blendIDA onlyIDA totalIndiaIndonesiaIran, Islamic Rep.IraqIrelandItalyJamaicaJapanJordanKazakhstanKenyaKiribatiKorea, Rep.KosovoKuwaitKyrgyz RepublicLao PDRLate-demographic dividendLatin America & Caribbean Latin America & Caribbean (excluding high income)Latin America & the Caribbean (IDA & IBRD countries)LatviaLeast developed countries: UN classificationLebanonLesothoLiberiaLibyaLiechtensteinLithuaniaLow & middle incomeLow incomeLower middle incomeLuxembourgMacao SAR, ChinaMacedonia, FYRMadagascarMalawiMalaysiaMaldivesMaliMaltaMarshall IslandsMauritaniaMauritiusMexicoMicronesia, Fed. Sts.Middle East & North AfricaMiddle East & North Africa (excluding high income)Middle East & North Africa (IDA & IBRD countries)Middle incomeMoldovaMongoliaMontenegroMoroccoMozambiqueMyanmarNamibiaNepalNetherlandsNew CaledoniaNew ZealandNicaraguaNigerNigeriaNorth AmericaNorwayOECD membersOmanOther small statesPacific island small statesPakistanPalauPanamaPapua New GuineaParaguayPeruPhilippinesPolandPortugalPost-demographic dividendPre-demographic dividendPuerto RicoQatarRomaniaRussian FederationRwandaSamoaSao Tome and PrincipeSaudi ArabiaSenegalSerbiaSeychellesSierra LeoneSingaporeSlovak RepublicSloveniaSmall statesSolomon IslandsSouth AfricaSouth AsiaSouth Asia (IDA & IBRD)SpainSri LankaSt. Kitts and NevisSt. LuciaSt. Vincent and the GrenadinesSub-Saharan Africa Sub-Saharan Africa (excluding high income)Sub-Saharan Africa (IDA & IBRD countries)SudanSurinameSwazilandSwedenSwitzerlandSyrian Arab RepublicTajikistanTanzaniaThailandTimor-LesteTogoTongaTrinidad and TobagoTunisiaTurkeyTurkmenistanTuvaluUgandaUkraineUnited Arab EmiratesUnited KingdomUnited StatesUpper middle incomeUruguayUzbekistanVanuatuVenezuela, RBVietnamWest Bank and GazaWorldYemen, Rep.ZambiaZimbabwe Timeline:
This timeline shows a graph from 1982 to 2016 of Sub-Saharan Africa (excluding high income). No data until 1981. Number of actual observations by date: 35.
Source name:
World Development Indicators
Source organization:
World Bank national accounts data, and OECD National Accounts data files.
Categories, topics:
Economy & Growth
Last updated:
apr 23, 2017
Indicators value changes by year
Minimum:
69.636 bln
jan 1, 1986
Maximum:
465.355 bln
jan 1, 2015
At the date of observation
Value
Absolute change
Change from previous value
jan 1, 1982
101.029 bln
+101.029 bln
0.0%
jan 1, 1983
87.684 bln
-13.346 bln
-13.21%
jan 1, 1984
82.295 bln
-5.388 bln
-6.15%
jan 1, 1985
77.383 bln
-4.912 bln
-5.97%
jan 1, 1986
69.636 bln
-7.747 bln
-10.01%
jan 1, 1987
75.454 bln
+5.818 bln
8.35%
jan 1, 1988
91.207 bln
+15.754 bln
20.88%
jan 1, 1989
95.039 bln
+3.832 bln
4.2%
jan 1, 1990
103.115 bln
+8.075 bln
8.5%
jan 1, 1991
103.657 bln
+542.46 mln
0.53%
jan 1, 1992
103.566 bln
-91.213 mln
-0.09%
jan 1, 1993
106.82 bln
+3.254 bln
3.14%
jan 1, 1994
95.483 bln
-11.336 bln
-10.61%
jan 1, 1995
92.703 bln
-2.78 bln
-2.91%
jan 1, 1996
108.49 bln
+15.786 bln
17.03%
jan 1, 1997
114.999 bln
+6.509 bln
6.0%
jan 1, 1998
114.696 bln
-302.644 mln
-0.26%
jan 1, 1999
100.15 bln
-14.546 bln
-12.68%
jan 1, 2000
104.016 bln
+3.866 bln
3.86%
jan 1, 2001
124.743 bln
+20.727 bln
19.93%
jan 1, 2002
109.262 bln
-15.481 bln
-12.41%
jan 1, 2003
111.349 bln
+2.088 bln
1.91%
jan 1, 2004
146.8 bln
+35.45 bln
31.84%
jan 1, 2005
190.762 bln
+43.962 bln
29.95%
jan 1, 2006
225.874 bln
+35.112 bln
18.41%
jan 1, 2007
259.5 bln
+33.626 bln
14.89%
jan 1, 2008
295.832 bln
+36.332 bln
14.0%
jan 1, 2009
349.084 bln
+53.253 bln
18.0%
jan 1, 2010
295.774 bln
-53.311 bln
-15.27%
jan 1, 2011
383.853 bln
+88.079 bln
29.78%
jan 1, 2012
453.462 bln
+69.609 bln
18.13%
jan 1, 2013
445.42 bln
-8.042 bln
-1.77%
jan 1, 2014
457.584 bln
+12.165 bln
2.73%
jan 1, 2015
465.355 bln
+7.771 bln
1.7%
jan 1, 2016
371.535 bln
-93.82 bln
-20.16%
Ranking of countries by current statistics by years


Comments: