29
/
en
AIzaSyAYiBZKx7MnpbEhh9jyipgxe19OcubqV5w
April 1, 2024
47237
Lower middle income
LMC
false
2
1
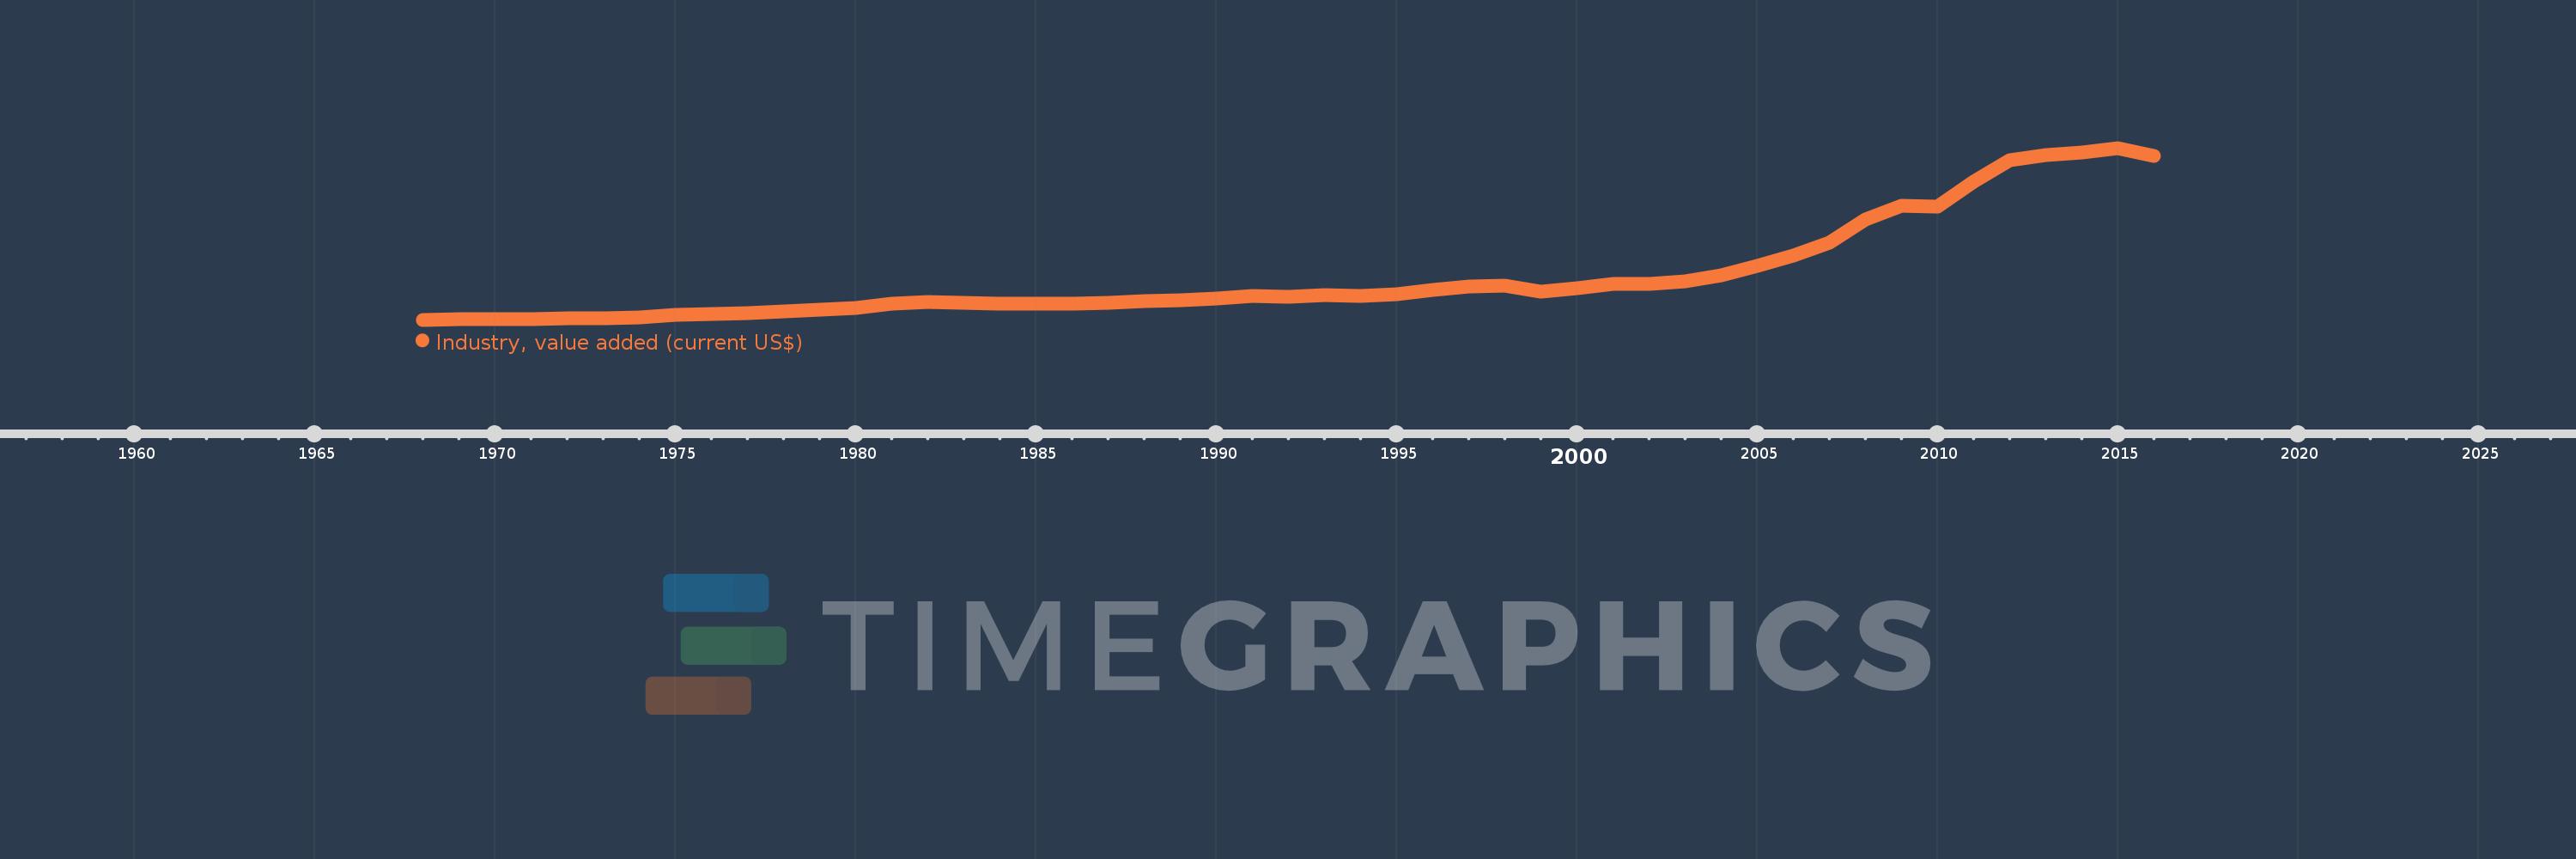
Industry, value added (current US$)
2016,2015,2014,2013,2012,2011,2010,2009,2008,2007,2006,2005,2004,2003,2002,2001,2000,1999,1998,1997,1996,1995,1994,1993,1992,1991,1990,1989,1988,1987,1986,1985,1984,1983,1982,1981,1980,1979,1978,1977,1976,1975,1974,1973,1972,1971,1970,1969,1968
This statistics in other country:
AfghanistanAlbaniaAlgeriaAndorraAngolaAntigua and BarbudaArab WorldArgentinaArmeniaArubaAustraliaAustriaAzerbaijanBahamas, TheBahrainBangladeshBarbadosBelarusBelgiumBelizeBeninBermudaBhutanBoliviaBosnia and HerzegovinaBotswanaBrazilBrunei DarussalamBulgariaBurkina FasoBurundiCabo VerdeCambodiaCameroonCanadaCaribbean small statesCayman IslandsCentral African RepublicCentral Europe and the BalticsChadChileChinaColombiaComorosCongo, Dem. Rep.Congo, Rep.Costa RicaCote d'IvoireCroatiaCubaCyprusCzech RepublicDenmarkDjiboutiDominicaDominican RepublicEarly-demographic dividendEast Asia & PacificEast Asia & Pacific (excluding high income)East Asia & Pacific (IDA & IBRD countries)EcuadorEgypt, Arab Rep.El SalvadorEquatorial GuineaEritreaEstoniaEthiopiaEuro areaEurope & Central AsiaEurope & Central Asia (excluding high income)Europe & Central Asia (IDA & IBRD countries)European UnionFijiFinlandFragile and conflict affected situationsFranceGabonGambia, TheGeorgiaGermanyGhanaGreeceGrenadaGuatemalaGuineaGuinea-BissauGuyanaHeavily indebted poor countries (HIPC)High incomeHondurasHong Kong SAR, ChinaHungaryIBRD onlyIcelandIDA & IBRD totalIDA blendIDA onlyIDA totalIndiaIndonesiaIran, Islamic Rep.IraqIrelandItalyJamaicaJapanJordanKazakhstanKenyaKiribatiKorea, Rep.KosovoKuwaitKyrgyz RepublicLao PDRLate-demographic dividendLatin America & Caribbean Latin America & Caribbean (excluding high income)Latin America & the Caribbean (IDA & IBRD countries)LatviaLeast developed countries: UN classificationLebanonLesothoLiberiaLibyaLiechtensteinLithuaniaLow & middle incomeLow incomeLower middle incomeLuxembourgMacao SAR, ChinaMacedonia, FYRMadagascarMalawiMalaysiaMaldivesMaliMaltaMarshall IslandsMauritaniaMauritiusMexicoMicronesia, Fed. Sts.Middle East & North AfricaMiddle East & North Africa (excluding high income)Middle East & North Africa (IDA & IBRD countries)Middle incomeMoldovaMongoliaMontenegroMoroccoMozambiqueMyanmarNamibiaNepalNetherlandsNew CaledoniaNew ZealandNicaraguaNigerNigeriaNorth AmericaNorwayOECD membersOmanOther small statesPacific island small statesPakistanPalauPanamaPapua New GuineaParaguayPeruPhilippinesPolandPortugalPost-demographic dividendPre-demographic dividendPuerto RicoQatarRomaniaRussian FederationRwandaSamoaSao Tome and PrincipeSaudi ArabiaSenegalSerbiaSeychellesSierra LeoneSingaporeSlovak RepublicSloveniaSmall statesSolomon IslandsSouth AfricaSouth AsiaSouth Asia (IDA & IBRD)SpainSri LankaSt. Kitts and NevisSt. LuciaSt. Vincent and the GrenadinesSub-Saharan Africa Sub-Saharan Africa (excluding high income)Sub-Saharan Africa (IDA & IBRD countries)SudanSurinameSwazilandSwedenSwitzerlandSyrian Arab RepublicTajikistanTanzaniaThailandTimor-LesteTogoTongaTrinidad and TobagoTunisiaTurkeyTurkmenistanTuvaluUgandaUkraineUnited Arab EmiratesUnited KingdomUnited StatesUpper middle incomeUruguayUzbekistanVanuatuVenezuela, RBVietnamWest Bank and GazaWorldYemen, Rep.ZambiaZimbabwe Timeline:
This timeline shows a graph from 1968 to 2016 of Lower middle income. No data until 1967. Number of actual observations by date: 49.
Source name:
World Development Indicators
Source organization:
World Bank national accounts data, and OECD National Accounts data files.
Categories, topics:
Economy & Growth
Last updated:
apr 23, 2017
Indicators value changes by year
Minimum:
29.263 bln
jan 1, 1968
Maximum:
1.754 trl
jan 1, 2015
At the date of observation
Value
Absolute change
Change from previous value
jan 1, 1968
29.263 bln
+29.263 bln
0.0%
jan 1, 1969
32.43 bln
+3.167 bln
10.82%
jan 1, 1970
37.361 bln
+4.931 bln
15.2%
jan 1, 1971
39.559 bln
+2.198 bln
5.88%
jan 1, 1972
43.03 bln
+3.471 bln
8.77%
jan 1, 1973
46.355 bln
+3.325 bln
7.73%
jan 1, 1974
55.693 bln
+9.338 bln
20.15%
jan 1, 1975
76.844 bln
+21.15 bln
37.98%
jan 1, 1976
84.313 bln
+7.469 bln
9.72%
jan 1, 1977
93.54 bln
+9.227 bln
10.94%
jan 1, 1978
109.631 bln
+16.09 bln
17.2%
jan 1, 1979
126.507 bln
+16.877 bln
15.39%
jan 1, 1980
149.189 bln
+22.682 bln
17.93%
jan 1, 1981
192.037 bln
+42.848 bln
28.72%
jan 1, 1982
208.446 bln
+16.409 bln
8.54%
jan 1, 1983
200.241 bln
-8.205 bln
-3.94%
jan 1, 1984
192.768 bln
-7.473 bln
-3.73%
jan 1, 1985
189.935 bln
-2.833 bln
-1.47%
jan 1, 1986
193.717 bln
+3.782 bln
1.99%
jan 1, 1987
195.457 bln
+1.74 bln
0.9%
jan 1, 1988
218.307 bln
+22.849 bln
11.69%
jan 1, 1989
228.976 bln
+10.67 bln
4.89%
jan 1, 1990
241.559 bln
+12.583 bln
5.5%
jan 1, 1991
266.313 bln
+24.754 bln
10.25%
jan 1, 1992
259.976 bln
-6.337 bln
-2.38%
jan 1, 1993
278.64 bln
+18.665 bln
7.18%
jan 1, 1994
265.443 bln
-13.198 bln
-4.74%
jan 1, 1995
289.698 bln
+24.256 bln
9.14%
jan 1, 1996
331.261 bln
+41.562 bln
14.35%
jan 1, 1997
366.161 bln
+34.9 bln
10.54%
jan 1, 1998
373.977 bln
+7.816 bln
2.13%
jan 1, 1999
313.659 bln
-60.318 bln
-16.13%
jan 1, 2000
346.423 bln
+32.764 bln
10.45%
jan 1, 2001
391.497 bln
+45.073 bln
13.01%
jan 1, 2002
384.82 bln
-6.677 bln
-1.71%
jan 1, 2003
416.053 bln
+31.234 bln
8.12%
jan 1, 2004
479.113 bln
+63.06 bln
15.16%
jan 1, 2005
572.382 bln
+93.269 bln
19.47%
jan 1, 2006
669.264 bln
+96.882 bln
16.93%
jan 1, 2007
806.492 bln
+137.227 bln
20.5%
jan 1, 2008
1.034 trl
+227.127 bln
28.16%
jan 1, 2009
1.172 trl
+138.389 bln
13.39%
jan 1, 2010
1.165 trl
-6.722 bln
-0.57%
jan 1, 2011
1.414 trl
+249.041 bln
21.37%
jan 1, 2012
1.632 trl
+217.424 bln
15.37%
jan 1, 2013
1.681 trl
+49.517 bln
3.03%
jan 1, 2014
1.705 trl
+23.257 bln
1.38%
jan 1, 2015
1.754 trl
+49.795 bln
2.92%
jan 1, 2016
1.673 trl
-81.065 bln
-4.62%
Ranking of countries by current statistics by years


Comments: