29
/
en
AIzaSyAYiBZKx7MnpbEhh9jyipgxe19OcubqV5w
April 1, 2024
252015
St. Vincent and the Grenadines
VCT
true
2
1
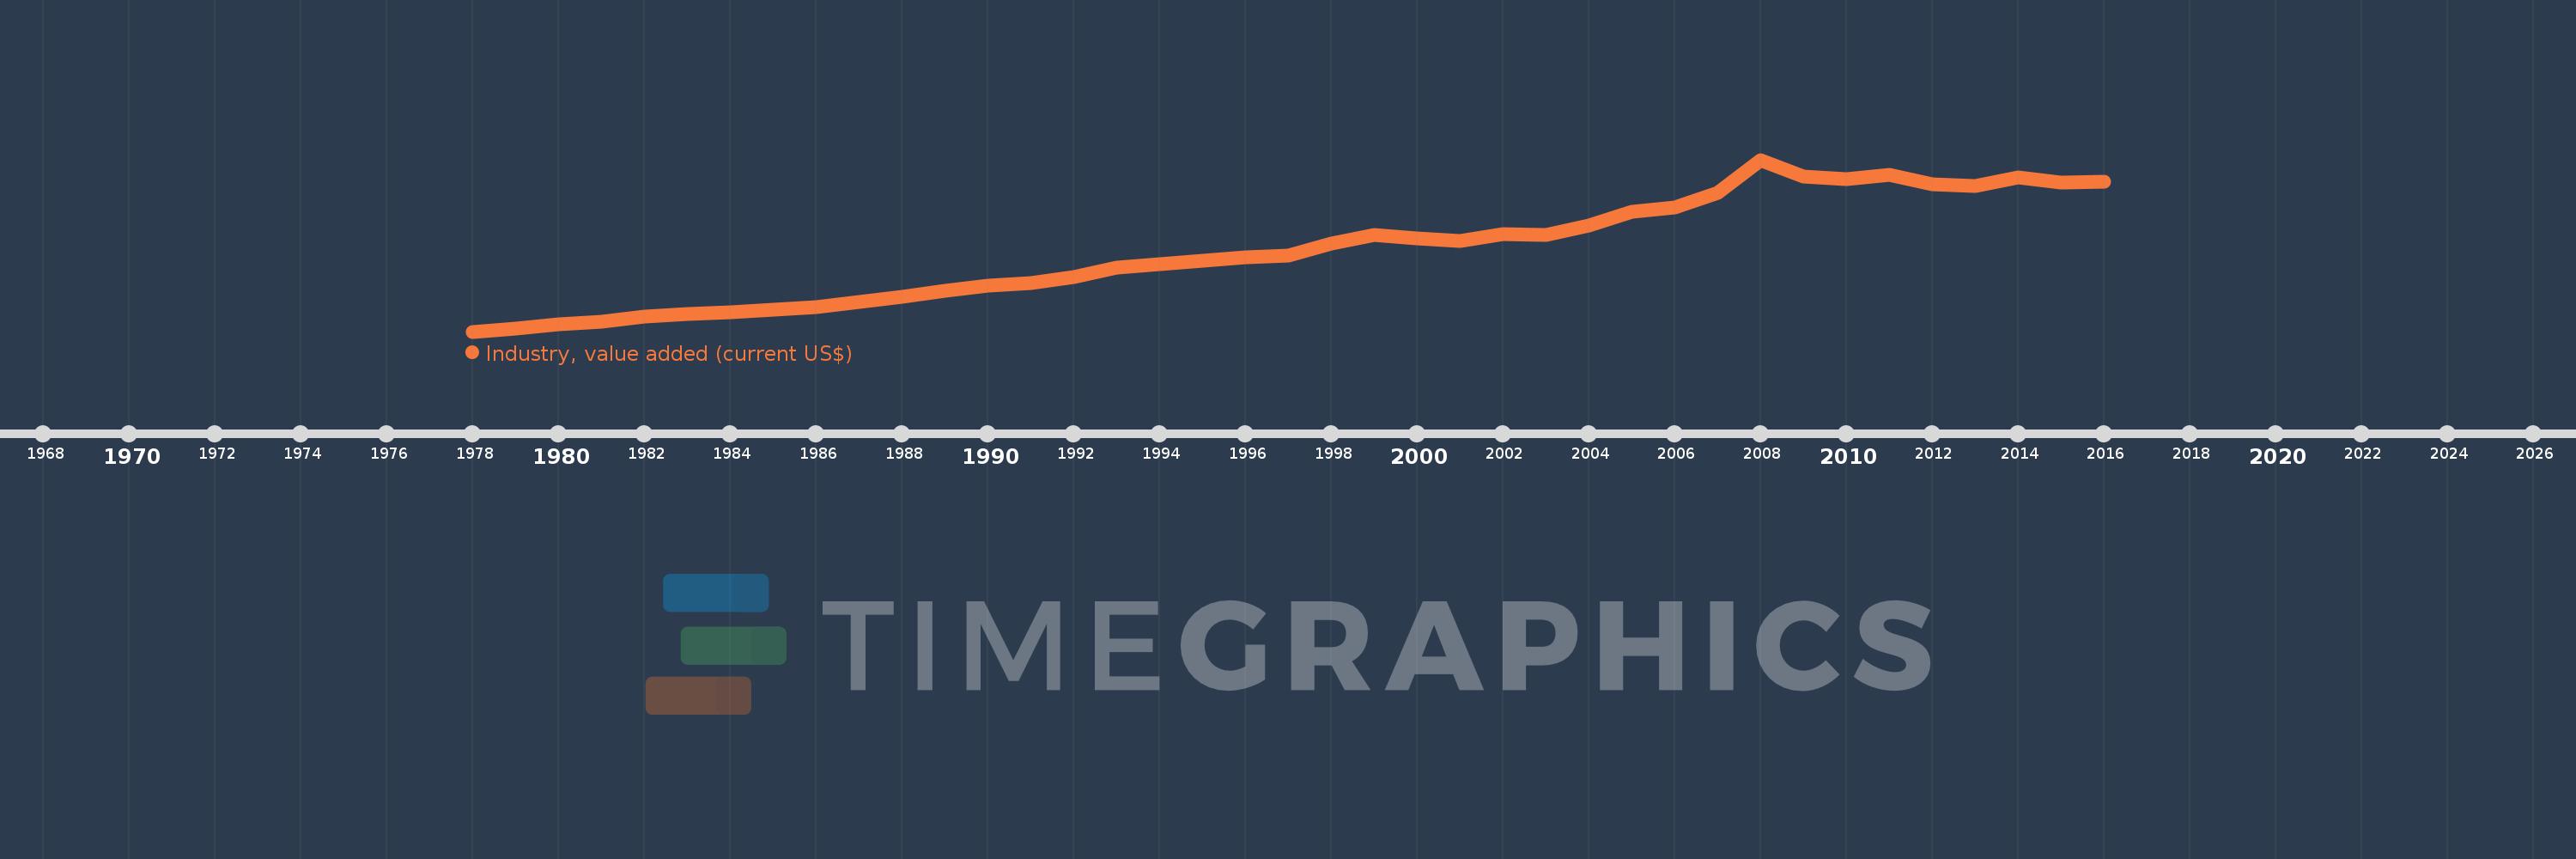
Industry, value added (current US$)
2016,2015,2014,2013,2012,2011,2010,2009,2008,2007,2006,2005,2004,2003,2002,2001,2000,1999,1998,1997,1996,1995,1994,1993,1992,1991,1990,1989,1988,1987,1986,1985,1984,1983,1982,1981,1980,1979,1978
This statistics in other country:
AfghanistanAlbaniaAlgeriaAndorraAngolaAntigua and BarbudaArab WorldArgentinaArmeniaArubaAustraliaAustriaAzerbaijanBahamas, TheBahrainBangladeshBarbadosBelarusBelgiumBelizeBeninBermudaBhutanBoliviaBosnia and HerzegovinaBotswanaBrazilBrunei DarussalamBulgariaBurkina FasoBurundiCabo VerdeCambodiaCameroonCanadaCaribbean small statesCayman IslandsCentral African RepublicCentral Europe and the BalticsChadChileChinaColombiaComorosCongo, Dem. Rep.Congo, Rep.Costa RicaCote d'IvoireCroatiaCubaCyprusCzech RepublicDenmarkDjiboutiDominicaDominican RepublicEarly-demographic dividendEast Asia & PacificEast Asia & Pacific (excluding high income)East Asia & Pacific (IDA & IBRD countries)EcuadorEgypt, Arab Rep.El SalvadorEquatorial GuineaEritreaEstoniaEthiopiaEuro areaEurope & Central AsiaEurope & Central Asia (excluding high income)Europe & Central Asia (IDA & IBRD countries)European UnionFijiFinlandFragile and conflict affected situationsFranceGabonGambia, TheGeorgiaGermanyGhanaGreeceGrenadaGuatemalaGuineaGuinea-BissauGuyanaHeavily indebted poor countries (HIPC)High incomeHondurasHong Kong SAR, ChinaHungaryIBRD onlyIcelandIDA & IBRD totalIDA blendIDA onlyIDA totalIndiaIndonesiaIran, Islamic Rep.IraqIrelandItalyJamaicaJapanJordanKazakhstanKenyaKiribatiKorea, Rep.KosovoKuwaitKyrgyz RepublicLao PDRLate-demographic dividendLatin America & Caribbean Latin America & Caribbean (excluding high income)Latin America & the Caribbean (IDA & IBRD countries)LatviaLeast developed countries: UN classificationLebanonLesothoLiberiaLibyaLiechtensteinLithuaniaLow & middle incomeLow incomeLower middle incomeLuxembourgMacao SAR, ChinaMacedonia, FYRMadagascarMalawiMalaysiaMaldivesMaliMaltaMarshall IslandsMauritaniaMauritiusMexicoMicronesia, Fed. Sts.Middle East & North AfricaMiddle East & North Africa (excluding high income)Middle East & North Africa (IDA & IBRD countries)Middle incomeMoldovaMongoliaMontenegroMoroccoMozambiqueMyanmarNamibiaNepalNetherlandsNew CaledoniaNew ZealandNicaraguaNigerNigeriaNorth AmericaNorwayOECD membersOmanOther small statesPacific island small statesPakistanPalauPanamaPapua New GuineaParaguayPeruPhilippinesPolandPortugalPost-demographic dividendPre-demographic dividendPuerto RicoQatarRomaniaRussian FederationRwandaSamoaSao Tome and PrincipeSaudi ArabiaSenegalSerbiaSeychellesSierra LeoneSingaporeSlovak RepublicSloveniaSmall statesSolomon IslandsSouth AfricaSouth AsiaSouth Asia (IDA & IBRD)SpainSri LankaSt. Kitts and NevisSt. LuciaSt. Vincent and the GrenadinesSub-Saharan Africa Sub-Saharan Africa (excluding high income)Sub-Saharan Africa (IDA & IBRD countries)SudanSurinameSwazilandSwedenSwitzerlandSyrian Arab RepublicTajikistanTanzaniaThailandTimor-LesteTogoTongaTrinidad and TobagoTunisiaTurkeyTurkmenistanTuvaluUgandaUkraineUnited Arab EmiratesUnited KingdomUnited StatesUpper middle incomeUruguayUzbekistanVanuatuVenezuela, RBVietnamWest Bank and GazaWorldYemen, Rep.ZambiaZimbabwe Timeline:
This timeline shows a graph from 1978 to 2016 of St. Vincent and the Grenadines. No data until 1977. Number of actual observations by date: 39.
Source name:
World Development Indicators
Source organization:
World Bank national accounts data, and OECD National Accounts data files.
Categories, topics:
Economy & Growth
Last updated:
apr 23, 2017
Indicators value changes by year
Minimum:
7.018 mln
jan 1, 1978
Maximum:
122.575 mln
jan 1, 2008
At the date of observation
Value
Absolute change
Change from previous value
jan 1, 1978
7.018 mln
+7.018 mln
0.0%
jan 1, 1979
9.262 mln
+2.244 mln
31.97%
jan 1, 1980
11.927 mln
+2.665 mln
28.77%
jan 1, 1981
13.909 mln
+1.982 mln
16.62%
jan 1, 1982
17.033 mln
+3.124 mln
22.46%
jan 1, 1983
18.808 mln
+1.776 mln
10.43%
jan 1, 1984
20.194 mln
+1.386 mln
7.37%
jan 1, 1985
21.489 mln
+1.295 mln
6.41%
jan 1, 1986
23.207 mln
+1.719 mln
8.0%
jan 1, 1987
26.992 mln
+3.785 mln
16.31%
jan 1, 1988
30.191 mln
+3.199 mln
11.85%
jan 1, 1989
34.712 mln
+4.521 mln
14.97%
jan 1, 1990
38.199 mln
+3.487 mln
10.05%
jan 1, 1991
39.404 mln
+1.205 mln
3.15%
jan 1, 1992
43.505 mln
+4.101 mln
10.41%
jan 1, 1993
49.858 mln
+6.353 mln
14.6%
jan 1, 1994
52.618 mln
+2.76 mln
5.54%
jan 1, 1995
54.786 mln
+2.168 mln
4.12%
jan 1, 1996
56.757 mln
+1.971 mln
3.6%
jan 1, 1997
58.402 mln
+1.644 mln
2.9%
jan 1, 1998
66.176 mln
+7.774 mln
13.31%
jan 1, 1999
71.919 mln
+5.743 mln
8.68%
jan 1, 2000
69.736 mln
-2.183 mln
-3.04%
jan 1, 2001
67.763 mln
-1.973 mln
-2.83%
jan 1, 2002
72.437 mln
+4.674 mln
6.9%
jan 1, 2003
72.014 mln
-422.704K
-0.58%
jan 1, 2004
78.088 mln
+6.074 mln
8.43%
jan 1, 2005
87.705 mln
+9.617 mln
12.32%
jan 1, 2006
90.233 mln
+2.528 mln
2.88%
jan 1, 2007
100.416 mln
+10.183 mln
11.28%
jan 1, 2008
122.575 mln
+22.159 mln
22.07%
jan 1, 2009
111.381 mln
-11.194 mln
-9.13%
jan 1, 2010
109.313 mln
-2.068 mln
-1.86%
jan 1, 2011
112.274 mln
+2.961 mln
2.71%
jan 1, 2012
105.837 mln
-6.437 mln
-5.73%
jan 1, 2013
105.018 mln
-819.074K
-0.77%
jan 1, 2014
110.6 mln
+5.582 mln
5.32%
jan 1, 2015
107.408 mln
-3.192 mln
-2.89%
jan 1, 2016
107.978 mln
+569.704K
0.53%
Ranking of countries by current statistics by years


Comments: