29
/
en
AIzaSyAYiBZKx7MnpbEhh9jyipgxe19OcubqV5w
April 1, 2024
164985
Jordan
JOR
true
2
1
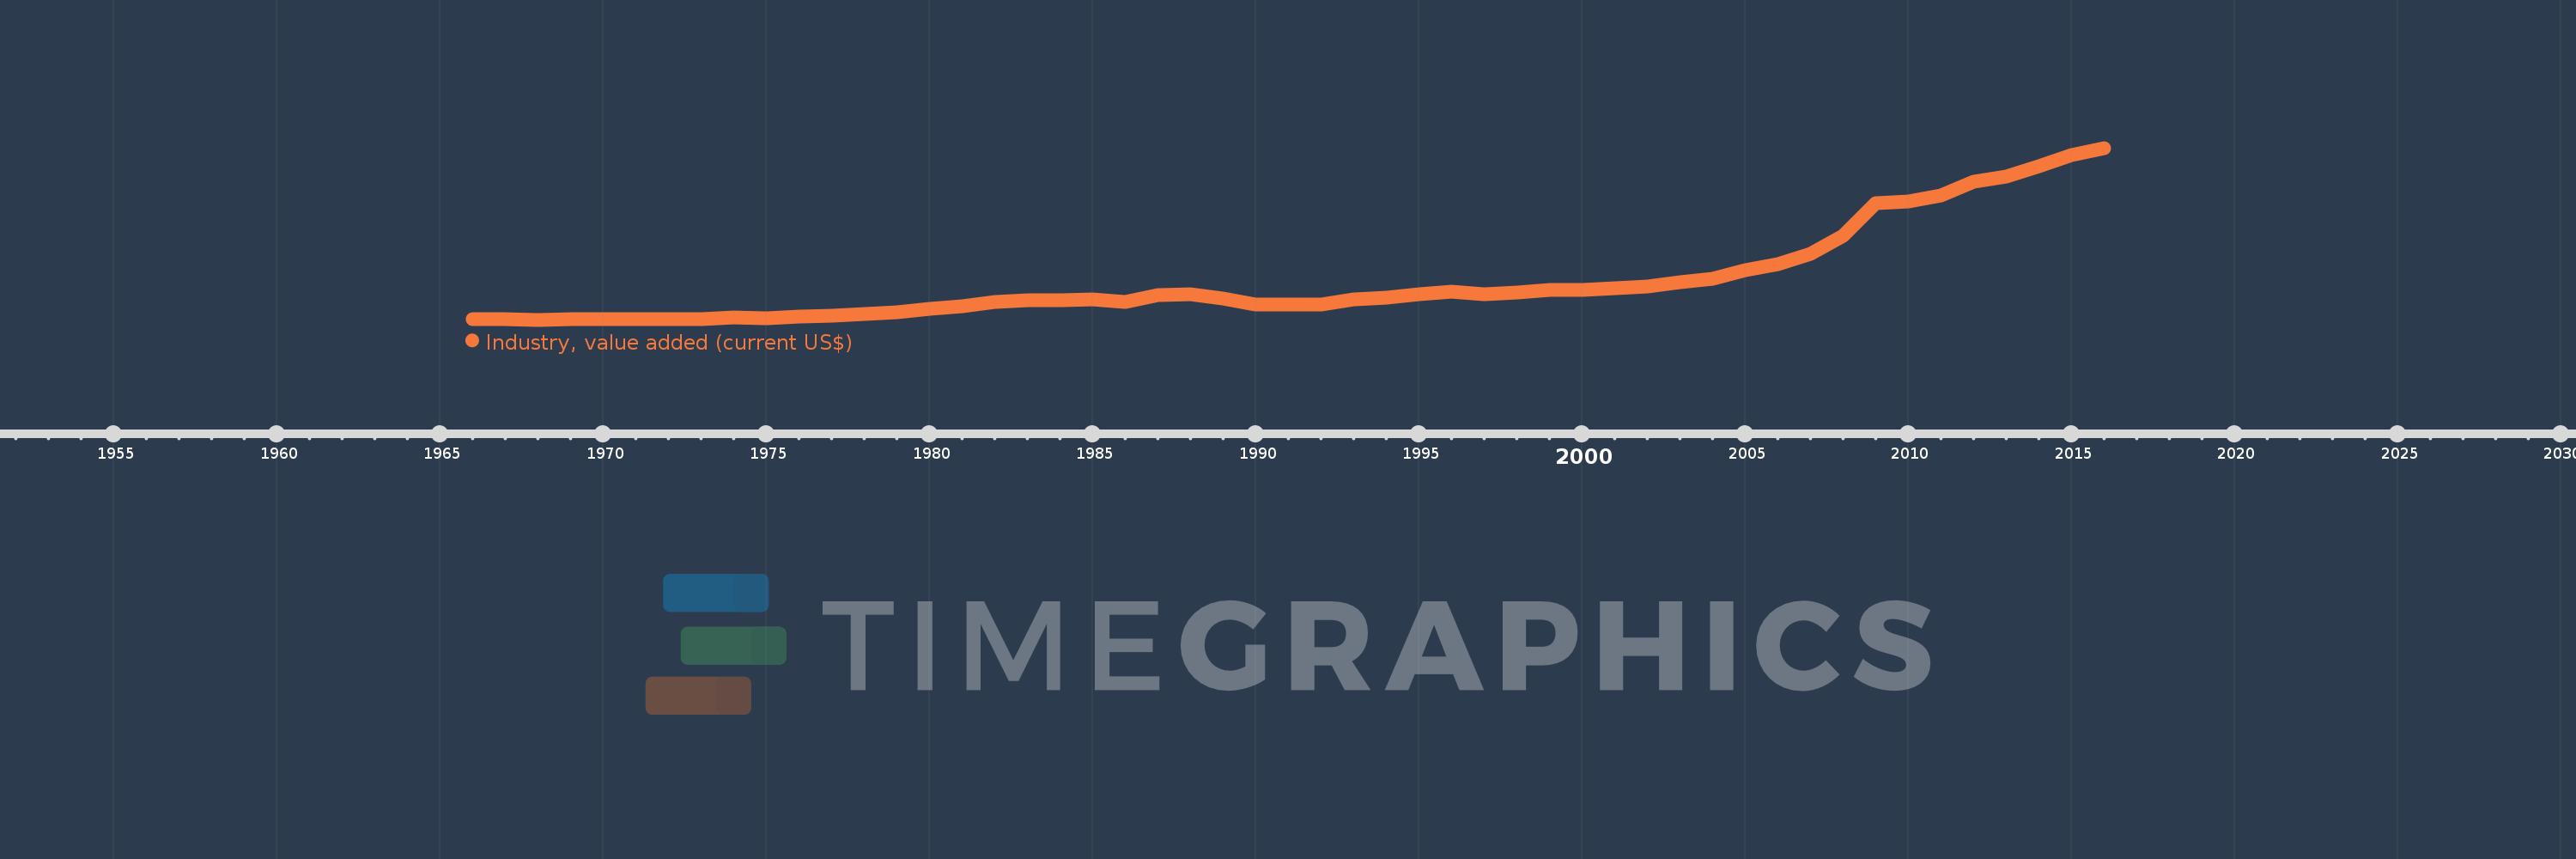
Industry, value added (current US$)
2016,2015,2014,2013,2012,2011,2010,2009,2008,2007,2006,2005,2004,2003,2002,2001,2000,1999,1998,1997,1996,1995,1994,1993,1992,1991,1990,1989,1988,1987,1986,1985,1984,1983,1982,1981,1980,1979,1978,1977,1976,1975,1974,1973,1972,1971,1970,1969,1968,1967,1966
This statistics in other country:
AfghanistanAlbaniaAlgeriaAndorraAngolaAntigua and BarbudaArab WorldArgentinaArmeniaArubaAustraliaAustriaAzerbaijanBahamas, TheBahrainBangladeshBarbadosBelarusBelgiumBelizeBeninBermudaBhutanBoliviaBosnia and HerzegovinaBotswanaBrazilBrunei DarussalamBulgariaBurkina FasoBurundiCabo VerdeCambodiaCameroonCanadaCaribbean small statesCayman IslandsCentral African RepublicCentral Europe and the BalticsChadChileChinaColombiaComorosCongo, Dem. Rep.Congo, Rep.Costa RicaCote d'IvoireCroatiaCubaCyprusCzech RepublicDenmarkDjiboutiDominicaDominican RepublicEarly-demographic dividendEast Asia & PacificEast Asia & Pacific (excluding high income)East Asia & Pacific (IDA & IBRD countries)EcuadorEgypt, Arab Rep.El SalvadorEquatorial GuineaEritreaEstoniaEthiopiaEuro areaEurope & Central AsiaEurope & Central Asia (excluding high income)Europe & Central Asia (IDA & IBRD countries)European UnionFijiFinlandFragile and conflict affected situationsFranceGabonGambia, TheGeorgiaGermanyGhanaGreeceGrenadaGuatemalaGuineaGuinea-BissauGuyanaHeavily indebted poor countries (HIPC)High incomeHondurasHong Kong SAR, ChinaHungaryIBRD onlyIcelandIDA & IBRD totalIDA blendIDA onlyIDA totalIndiaIndonesiaIran, Islamic Rep.IraqIrelandItalyJamaicaJapanJordanKazakhstanKenyaKiribatiKorea, Rep.KosovoKuwaitKyrgyz RepublicLao PDRLate-demographic dividendLatin America & Caribbean Latin America & Caribbean (excluding high income)Latin America & the Caribbean (IDA & IBRD countries)LatviaLeast developed countries: UN classificationLebanonLesothoLiberiaLibyaLiechtensteinLithuaniaLow & middle incomeLow incomeLower middle incomeLuxembourgMacao SAR, ChinaMacedonia, FYRMadagascarMalawiMalaysiaMaldivesMaliMaltaMarshall IslandsMauritaniaMauritiusMexicoMicronesia, Fed. Sts.Middle East & North AfricaMiddle East & North Africa (excluding high income)Middle East & North Africa (IDA & IBRD countries)Middle incomeMoldovaMongoliaMontenegroMoroccoMozambiqueMyanmarNamibiaNepalNetherlandsNew CaledoniaNew ZealandNicaraguaNigerNigeriaNorth AmericaNorwayOECD membersOmanOther small statesPacific island small statesPakistanPalauPanamaPapua New GuineaParaguayPeruPhilippinesPolandPortugalPost-demographic dividendPre-demographic dividendPuerto RicoQatarRomaniaRussian FederationRwandaSamoaSao Tome and PrincipeSaudi ArabiaSenegalSerbiaSeychellesSierra LeoneSingaporeSlovak RepublicSloveniaSmall statesSolomon IslandsSouth AfricaSouth AsiaSouth Asia (IDA & IBRD)SpainSri LankaSt. Kitts and NevisSt. LuciaSt. Vincent and the GrenadinesSub-Saharan Africa Sub-Saharan Africa (excluding high income)Sub-Saharan Africa (IDA & IBRD countries)SudanSurinameSwazilandSwedenSwitzerlandSyrian Arab RepublicTajikistanTanzaniaThailandTimor-LesteTogoTongaTrinidad and TobagoTunisiaTurkeyTurkmenistanTuvaluUgandaUkraineUnited Arab EmiratesUnited KingdomUnited StatesUpper middle incomeUruguayUzbekistanVanuatuVenezuela, RBVietnamWest Bank and GazaWorldYemen, Rep.ZambiaZimbabwe Timeline:
This timeline shows a graph from 1966 to 2016 of Jordan. No data until 1965. Number of actual observations by date: 51.
Source name:
World Development Indicators
Source organization:
World Bank national accounts data, and OECD National Accounts data files.
Categories, topics:
Economy & Growth
Last updated:
apr 23, 2017
Indicators value changes by year
Minimum:
96.332 mln
jan 1, 1968
Maximum:
9.801 bln
jan 1, 2016
At the date of observation
Value
Absolute change
Change from previous value
jan 1, 1966
106.133 mln
+106.133 mln
0.0%
jan 1, 1967
121.255 mln
+15.122 mln
14.25%
jan 1, 1968
96.332 mln
-24.923 mln
-20.55%
jan 1, 1969
120.975 mln
+24.643 mln
25.58%
jan 1, 1970
131.336 mln
+10.361 mln
8.56%
jan 1, 1971
112.293 mln
-19.042 mln
-14.5%
jan 1, 1972
110.893 mln
-1.4 mln
-1.25%
jan 1, 1973
145.617 mln
+34.724 mln
31.31%
jan 1, 1974
209.982 mln
+64.364 mln
44.2%
jan 1, 1975
194.66 mln
-15.322 mln
-7.3%
jan 1, 1976
282.989 mln
+88.329 mln
45.38%
jan 1, 1977
331.627 mln
+48.637 mln
17.19%
jan 1, 1978
415.427 mln
+83.8 mln
25.27%
jan 1, 1979
525.196 mln
+109.77 mln
26.42%
jan 1, 1980
708.292 mln
+183.095 mln
34.86%
jan 1, 1981
858.342 mln
+150.05 mln
21.18%
jan 1, 1982
1.083 bln
+224.891 mln
26.2%
jan 1, 1983
1.195 bln
+111.377 mln
10.28%
jan 1, 1984
1.185 bln
-9.812 mln
-0.82%
jan 1, 1985
1.243 bln
+58.115 mln
4.91%
jan 1, 1986
1.102 bln
-140.531 mln
-11.31%
jan 1, 1987
1.472 bln
+369.618 mln
33.53%
jan 1, 1988
1.55 bln
+78.074 mln
5.3%
jan 1, 1989
1.319 bln
-231.078 mln
-14.91%
jan 1, 1990
966.063 mln
-352.932 mln
-26.76%
jan 1, 1991
974.085 mln
+8.021 mln
0.83%
jan 1, 1992
943.163 mln
-30.921 mln
-3.17%
jan 1, 1993
1.264 bln
+321.178 mln
34.05%
jan 1, 1994
1.321 bln
+56.344 mln
4.46%
jan 1, 1995
1.539 bln
+218.493 mln
16.54%
jan 1, 1996
1.659 bln
+119.583 mln
7.77%
jan 1, 1997
1.527 bln
-131.405 mln
-7.92%
jan 1, 1998
1.622 bln
+94.427 mln
6.18%
jan 1, 1999
1.761 bln
+138.761 mln
8.56%
jan 1, 2000
1.778 bln
+17.908 mln
1.02%
jan 1, 2001
1.857 bln
+78.369 mln
4.41%
jan 1, 2002
1.987 bln
+130.676 mln
7.04%
jan 1, 2003
2.235 bln
+247.468 mln
12.45%
jan 1, 2004
2.404 bln
+168.781 mln
7.55%
jan 1, 2005
2.902 bln
+498.679 mln
20.75%
jan 1, 2006
3.214 bln
+311.3 mln
10.73%
jan 1, 2007
3.827 bln
+613.329 mln
19.08%
jan 1, 2008
4.818 bln
+991.363 mln
25.9%
jan 1, 2009
6.662 bln
+1.844 bln
38.26%
jan 1, 2010
6.798 bln
+135.535 mln
2.03%
jan 1, 2011
7.104 bln
+306.766 mln
4.51%
jan 1, 2012
7.879 bln
+774.87 mln
10.91%
jan 1, 2013
8.171 bln
+291.832 mln
3.7%
jan 1, 2014
8.774 bln
+603.361 mln
7.38%
jan 1, 2015
9.386 bln
+611.127 mln
6.96%
jan 1, 2016
9.801 bln
+414.918 mln
4.42%
Ranking of countries by current statistics by years


Comments: