29
/
en
AIzaSyAYiBZKx7MnpbEhh9jyipgxe19OcubqV5w
April 1, 2024
66148
Algeria
DZA
true
2
1
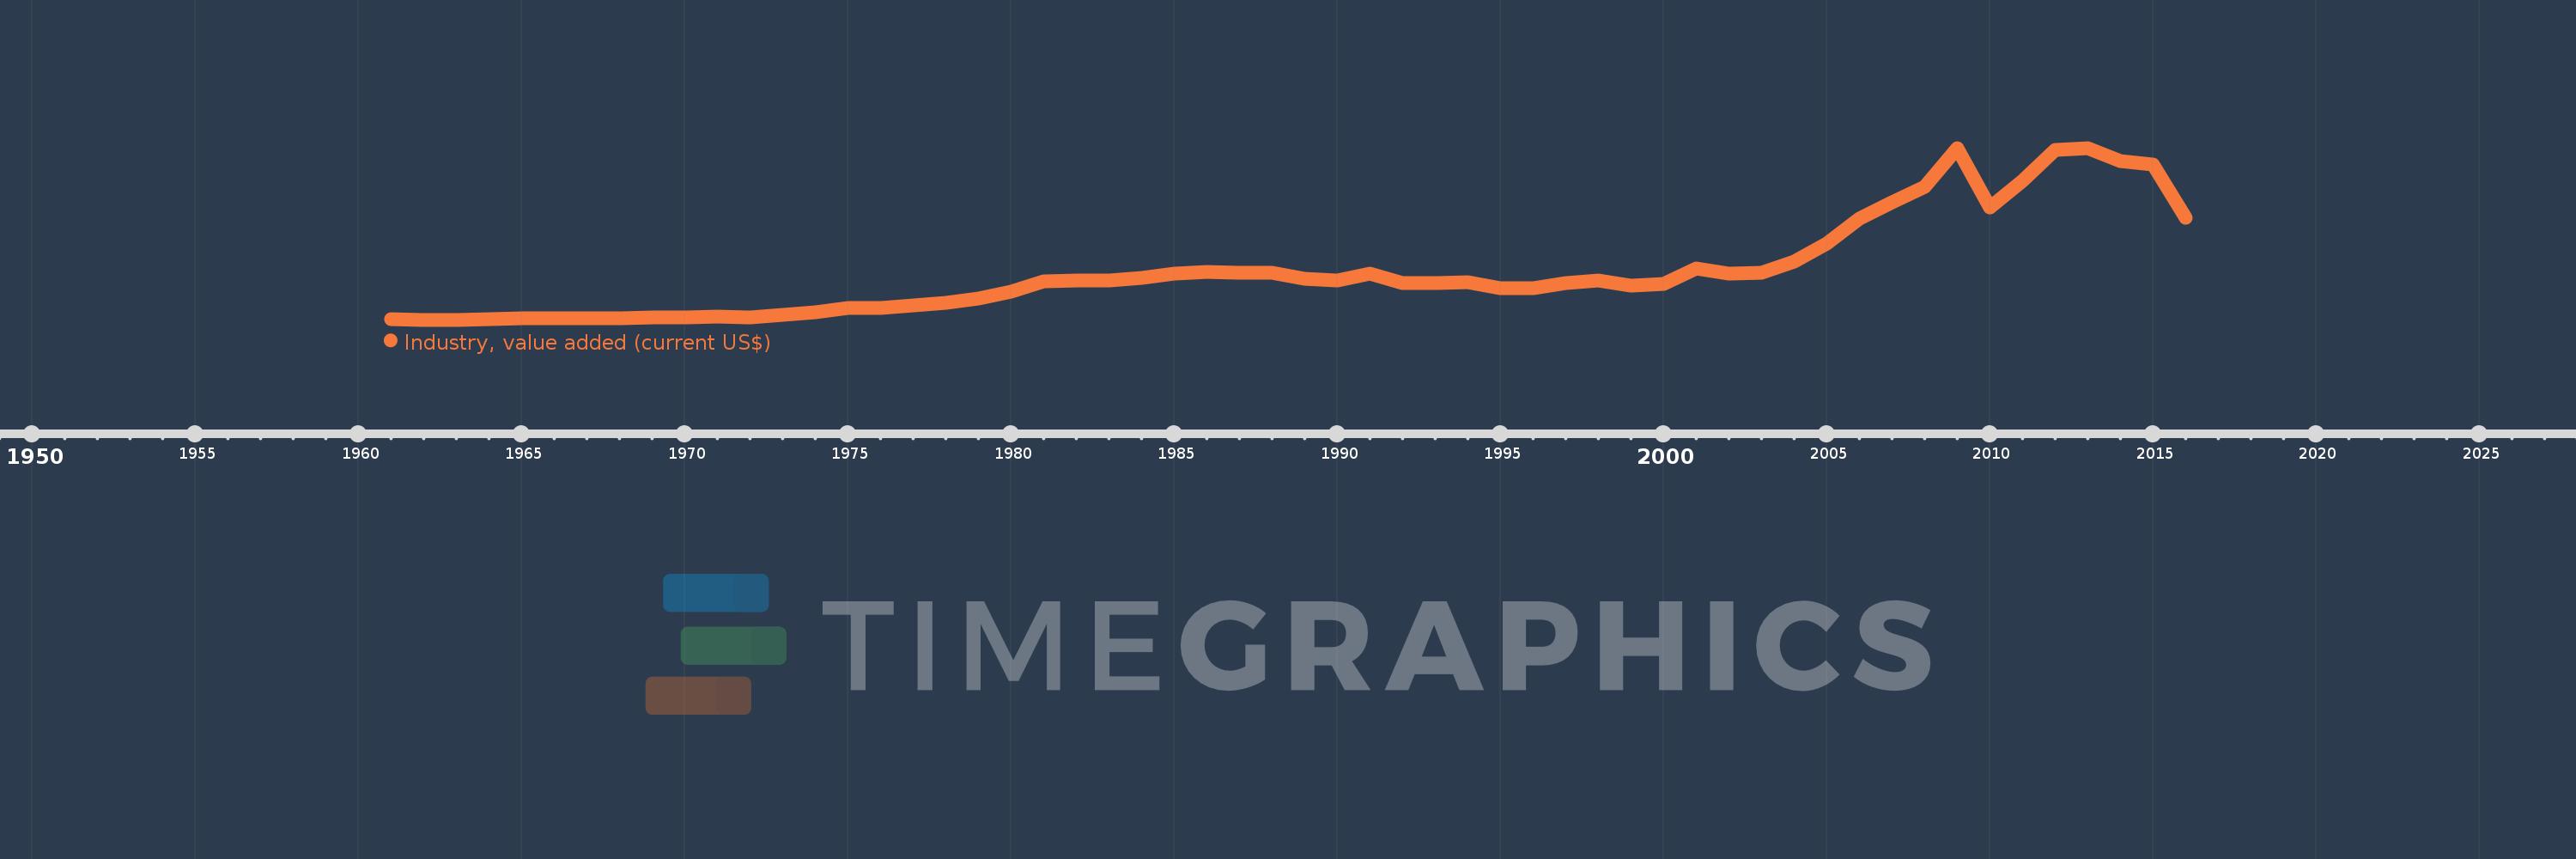
Industry, value added (current US$)
2016,2015,2014,2013,2012,2011,2010,2009,2008,2007,2006,2005,2004,2003,2002,2001,2000,1999,1998,1997,1996,1995,1994,1993,1992,1991,1990,1989,1988,1987,1986,1985,1984,1983,1982,1981,1980,1979,1978,1977,1976,1975,1974,1973,1972,1971,1970,1969,1968,1967,1966,1965,1964,1963,1962,1961
This statistics in other country:
AfghanistanAlbaniaAlgeriaAndorraAngolaAntigua and BarbudaArab WorldArgentinaArmeniaArubaAustraliaAustriaAzerbaijanBahamas, TheBahrainBangladeshBarbadosBelarusBelgiumBelizeBeninBermudaBhutanBoliviaBosnia and HerzegovinaBotswanaBrazilBrunei DarussalamBulgariaBurkina FasoBurundiCabo VerdeCambodiaCameroonCanadaCaribbean small statesCayman IslandsCentral African RepublicCentral Europe and the BalticsChadChileChinaColombiaComorosCongo, Dem. Rep.Congo, Rep.Costa RicaCote d'IvoireCroatiaCubaCyprusCzech RepublicDenmarkDjiboutiDominicaDominican RepublicEarly-demographic dividendEast Asia & PacificEast Asia & Pacific (excluding high income)East Asia & Pacific (IDA & IBRD countries)EcuadorEgypt, Arab Rep.El SalvadorEquatorial GuineaEritreaEstoniaEthiopiaEuro areaEurope & Central AsiaEurope & Central Asia (excluding high income)Europe & Central Asia (IDA & IBRD countries)European UnionFijiFinlandFragile and conflict affected situationsFranceGabonGambia, TheGeorgiaGermanyGhanaGreeceGrenadaGuatemalaGuineaGuinea-BissauGuyanaHeavily indebted poor countries (HIPC)High incomeHondurasHong Kong SAR, ChinaHungaryIBRD onlyIcelandIDA & IBRD totalIDA blendIDA onlyIDA totalIndiaIndonesiaIran, Islamic Rep.IraqIrelandItalyJamaicaJapanJordanKazakhstanKenyaKiribatiKorea, Rep.KosovoKuwaitKyrgyz RepublicLao PDRLate-demographic dividendLatin America & Caribbean Latin America & Caribbean (excluding high income)Latin America & the Caribbean (IDA & IBRD countries)LatviaLeast developed countries: UN classificationLebanonLesothoLiberiaLibyaLiechtensteinLithuaniaLow & middle incomeLow incomeLower middle incomeLuxembourgMacao SAR, ChinaMacedonia, FYRMadagascarMalawiMalaysiaMaldivesMaliMaltaMarshall IslandsMauritaniaMauritiusMexicoMicronesia, Fed. Sts.Middle East & North AfricaMiddle East & North Africa (excluding high income)Middle East & North Africa (IDA & IBRD countries)Middle incomeMoldovaMongoliaMontenegroMoroccoMozambiqueMyanmarNamibiaNepalNetherlandsNew CaledoniaNew ZealandNicaraguaNigerNigeriaNorth AmericaNorwayOECD membersOmanOther small statesPacific island small statesPakistanPalauPanamaPapua New GuineaParaguayPeruPhilippinesPolandPortugalPost-demographic dividendPre-demographic dividendPuerto RicoQatarRomaniaRussian FederationRwandaSamoaSao Tome and PrincipeSaudi ArabiaSenegalSerbiaSeychellesSierra LeoneSingaporeSlovak RepublicSloveniaSmall statesSolomon IslandsSouth AfricaSouth AsiaSouth Asia (IDA & IBRD)SpainSri LankaSt. Kitts and NevisSt. LuciaSt. Vincent and the GrenadinesSub-Saharan Africa Sub-Saharan Africa (excluding high income)Sub-Saharan Africa (IDA & IBRD countries)SudanSurinameSwazilandSwedenSwitzerlandSyrian Arab RepublicTajikistanTanzaniaThailandTimor-LesteTogoTongaTrinidad and TobagoTunisiaTurkeyTurkmenistanTuvaluUgandaUkraineUnited Arab EmiratesUnited KingdomUnited StatesUpper middle incomeUruguayUzbekistanVanuatuVenezuela, RBVietnamWest Bank and GazaWorldYemen, Rep.ZambiaZimbabwe Timeline:
This timeline shows a graph from 1961 to 2016 of Algeria. No data until 1960. Number of actual observations by date: 56.
Source name:
World Development Indicators
Source organization:
World Bank national accounts data, and OECD National Accounts data files.
Categories, topics:
Economy & Growth
Last updated:
apr 23, 2017
Indicators value changes by year
Minimum:
634.413 mln
jan 1, 1963
Maximum:
100.242 bln
jan 1, 2009
At the date of observation
Value
Absolute change
Change from previous value
jan 1, 1961
799.912 mln
+799.912 mln
0.0%
jan 1, 1962
717.163 mln
-82.75 mln
-10.34%
jan 1, 1963
634.413 mln
-82.75 mln
-11.54%
jan 1, 1964
1.103 bln
+468.914 mln
73.91%
jan 1, 1965
1.241 bln
+137.916 mln
12.5%
jan 1, 1966
1.324 bln
+82.739 mln
6.67%
jan 1, 1967
1.414 bln
+90.1 mln
6.81%
jan 1, 1968
1.612 bln
+198.02 mln
14.0%
jan 1, 1969
1.836 bln
+223.947 mln
13.89%
jan 1, 1970
2.036 bln
+199.619 mln
10.87%
jan 1, 1971
2.332 bln
+296.373 mln
14.56%
jan 1, 1972
2.216 bln
-115.704 mln
-4.96%
jan 1, 1973
3.462 bln
+1.245 bln
56.19%
jan 1, 1974
4.979 bln
+1.517 bln
43.83%
jan 1, 1975
7.268 bln
+2.289 bln
45.98%
jan 1, 1976
7.22 bln
-47.985 mln
-0.66%
jan 1, 1977
8.887 bln
+1.666 bln
23.08%
jan 1, 1978
10.676 bln
+1.79 bln
20.14%
jan 1, 1979
12.973 bln
+2.296 bln
21.51%
jan 1, 1980
16.895 bln
+3.922 bln
30.23%
jan 1, 1981
22.775 bln
+5.881 bln
34.81%
jan 1, 1982
23.333 bln
+557.625 mln
2.45%
jan 1, 1983
23.453 bln
+119.945 mln
0.51%
jan 1, 1984
24.975 bln
+1.522 bln
6.49%
jan 1, 1985
27.21 bln
+2.235 bln
8.95%
jan 1, 1986
28.541 bln
+1.331 bln
4.89%
jan 1, 1987
27.946 bln
-595.756 mln
-2.09%
jan 1, 1988
28.103 bln
+157.54 mln
0.56%
jan 1, 1989
24.481 bln
-3.622 bln
-12.89%
jan 1, 1990
23.314 bln
-1.166 bln
-4.76%
jan 1, 1991
27.316 bln
+4.002 bln
17.16%
jan 1, 1992
22.048 bln
-5.268 bln
-19.29%
jan 1, 1993
22.042 bln
-6.814 mln
-0.03%
jan 1, 1994
22.493 bln
+451.457 mln
2.05%
jan 1, 1995
19.119 bln
-3.374 bln
-15.0%
jan 1, 1996
19.139 bln
+19.336 mln
0.1%
jan 1, 1997
22.092 bln
+2.953 bln
15.43%
jan 1, 1998
23.2 bln
+1.108 bln
5.02%
jan 1, 1999
20.36 bln
-2.84 bln
-12.24%
jan 1, 2000
21.256 bln
+896.489 mln
4.4%
jan 1, 2001
30.36 bln
+9.104 bln
42.83%
jan 1, 2002
27.431 bln
-2.929 bln
-9.65%
jan 1, 2003
27.918 bln
+486.968 mln
1.78%
jan 1, 2004
34.492 bln
+6.574 bln
23.55%
jan 1, 2005
44.625 bln
+10.133 bln
29.38%
jan 1, 2006
59.168 bln
+14.543 bln
32.59%
jan 1, 2007
68.911 bln
+9.743 bln
16.47%
jan 1, 2008
77.847 bln
+8.936 bln
12.97%
jan 1, 2009
100.242 bln
+22.395 bln
28.77%
jan 1, 2010
65.723 bln
-34.519 bln
-34.44%
jan 1, 2011
81.402 bln
+15.68 bln
23.86%
jan 1, 2012
99.256 bln
+17.854 bln
21.93%
jan 1, 2013
100.034 bln
+777.583 mln
0.78%
jan 1, 2014
92.742 bln
-7.291 bln
-7.29%
jan 1, 2015
90.455 bln
-2.287 bln
-2.47%
jan 1, 2016
59.815 bln
-30.641 bln
-33.87%
Ranking of countries by current statistics by years


Comments: