29
/
en
AIzaSyAYiBZKx7MnpbEhh9jyipgxe19OcubqV5w
April 1, 2024
256479
Sweden
SWE
true
2
1
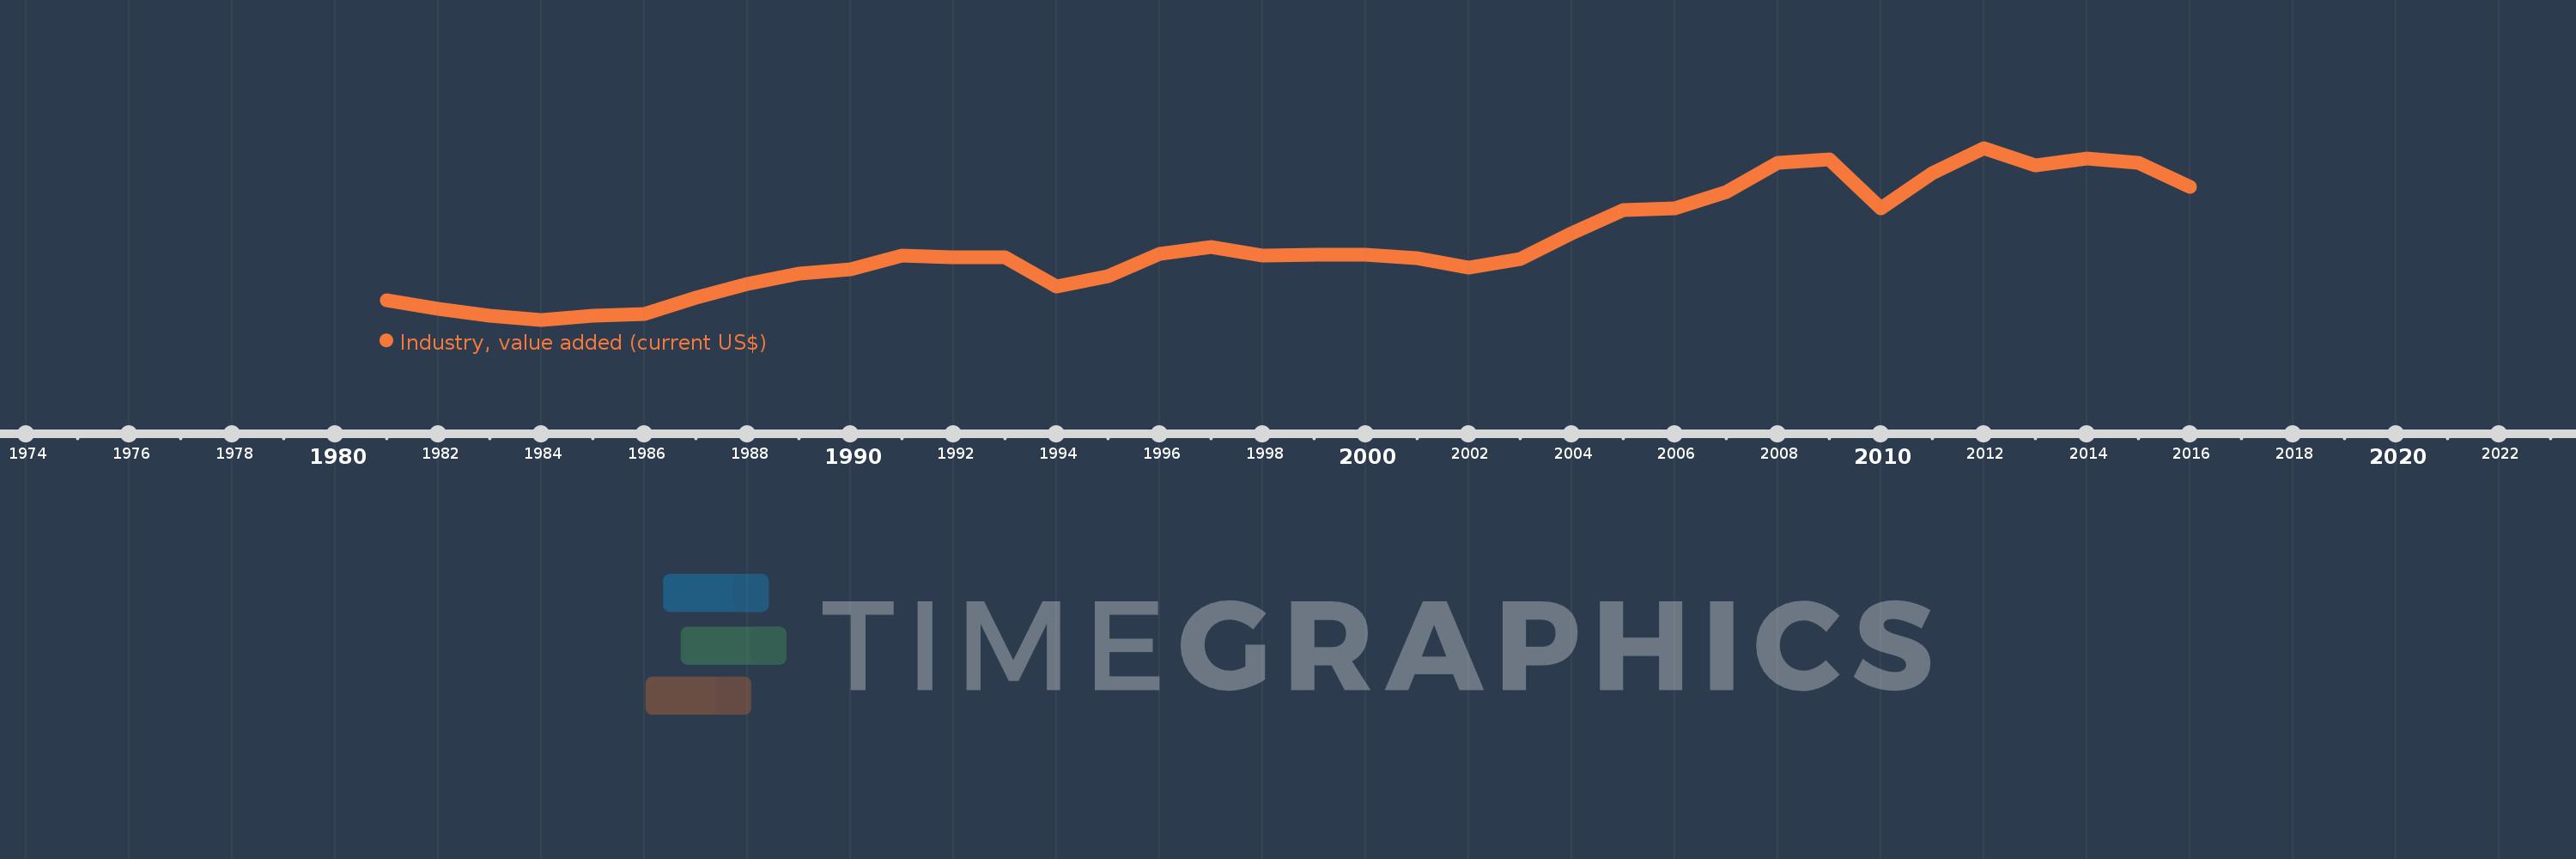
Industry, value added (current US$)
2016,2015,2014,2013,2012,2011,2010,2009,2008,2007,2006,2005,2004,2003,2002,2001,2000,1999,1998,1997,1996,1995,1994,1993,1992,1991,1990,1989,1988,1987,1986,1985,1984,1983,1982,1981
This statistics in other country:
AfghanistanAlbaniaAlgeriaAndorraAngolaAntigua and BarbudaArab WorldArgentinaArmeniaArubaAustraliaAustriaAzerbaijanBahamas, TheBahrainBangladeshBarbadosBelarusBelgiumBelizeBeninBermudaBhutanBoliviaBosnia and HerzegovinaBotswanaBrazilBrunei DarussalamBulgariaBurkina FasoBurundiCabo VerdeCambodiaCameroonCanadaCaribbean small statesCayman IslandsCentral African RepublicCentral Europe and the BalticsChadChileChinaColombiaComorosCongo, Dem. Rep.Congo, Rep.Costa RicaCote d'IvoireCroatiaCubaCyprusCzech RepublicDenmarkDjiboutiDominicaDominican RepublicEarly-demographic dividendEast Asia & PacificEast Asia & Pacific (excluding high income)East Asia & Pacific (IDA & IBRD countries)EcuadorEgypt, Arab Rep.El SalvadorEquatorial GuineaEritreaEstoniaEthiopiaEuro areaEurope & Central AsiaEurope & Central Asia (excluding high income)Europe & Central Asia (IDA & IBRD countries)European UnionFijiFinlandFragile and conflict affected situationsFranceGabonGambia, TheGeorgiaGermanyGhanaGreeceGrenadaGuatemalaGuineaGuinea-BissauGuyanaHeavily indebted poor countries (HIPC)High incomeHondurasHong Kong SAR, ChinaHungaryIBRD onlyIcelandIDA & IBRD totalIDA blendIDA onlyIDA totalIndiaIndonesiaIran, Islamic Rep.IraqIrelandItalyJamaicaJapanJordanKazakhstanKenyaKiribatiKorea, Rep.KosovoKuwaitKyrgyz RepublicLao PDRLate-demographic dividendLatin America & Caribbean Latin America & Caribbean (excluding high income)Latin America & the Caribbean (IDA & IBRD countries)LatviaLeast developed countries: UN classificationLebanonLesothoLiberiaLibyaLiechtensteinLithuaniaLow & middle incomeLow incomeLower middle incomeLuxembourgMacao SAR, ChinaMacedonia, FYRMadagascarMalawiMalaysiaMaldivesMaliMaltaMarshall IslandsMauritaniaMauritiusMexicoMicronesia, Fed. Sts.Middle East & North AfricaMiddle East & North Africa (excluding high income)Middle East & North Africa (IDA & IBRD countries)Middle incomeMoldovaMongoliaMontenegroMoroccoMozambiqueMyanmarNamibiaNepalNetherlandsNew CaledoniaNew ZealandNicaraguaNigerNigeriaNorth AmericaNorwayOECD membersOmanOther small statesPacific island small statesPakistanPalauPanamaPapua New GuineaParaguayPeruPhilippinesPolandPortugalPost-demographic dividendPre-demographic dividendPuerto RicoQatarRomaniaRussian FederationRwandaSamoaSao Tome and PrincipeSaudi ArabiaSenegalSerbiaSeychellesSierra LeoneSingaporeSlovak RepublicSloveniaSmall statesSolomon IslandsSouth AfricaSouth AsiaSouth Asia (IDA & IBRD)SpainSri LankaSt. Kitts and NevisSt. LuciaSt. Vincent and the GrenadinesSub-Saharan Africa Sub-Saharan Africa (excluding high income)Sub-Saharan Africa (IDA & IBRD countries)SudanSurinameSwazilandSwedenSwitzerlandSyrian Arab RepublicTajikistanTanzaniaThailandTimor-LesteTogoTongaTrinidad and TobagoTunisiaTurkeyTurkmenistanTuvaluUgandaUkraineUnited Arab EmiratesUnited KingdomUnited StatesUpper middle incomeUruguayUzbekistanVanuatuVenezuela, RBVietnamWest Bank and GazaWorldYemen, Rep.ZambiaZimbabwe Timeline:
This timeline shows a graph from 1981 to 2016 of Sweden. No data until 1980. Number of actual observations by date: 36.
Source name:
World Development Indicators
Source organization:
World Bank national accounts data, and OECD National Accounts data files.
Categories, topics:
Economy & Growth
Last updated:
apr 23, 2017
Indicators value changes by year
Minimum:
29.984 bln
jan 1, 1984
Maximum:
140.162 bln
jan 1, 2012
At the date of observation
Value
Absolute change
Change from previous value
jan 1, 1981
42.383 bln
+42.383 bln
0.0%
jan 1, 1982
37.111 bln
-5.273 bln
-12.44%
jan 1, 1983
32.387 bln
-4.724 bln
-12.73%
jan 1, 1984
29.984 bln
-2.402 bln
-7.42%
jan 1, 1985
32.401 bln
+2.417 bln
8.06%
jan 1, 1986
33.882 bln
+1.481 bln
4.57%
jan 1, 1987
44.078 bln
+10.196 bln
30.09%
jan 1, 1988
53.018 bln
+8.94 bln
20.28%
jan 1, 1989
59.57 bln
+6.552 bln
12.36%
jan 1, 1990
62.246 bln
+2.676 bln
4.49%
jan 1, 1991
71.392 bln
+9.147 bln
14.69%
jan 1, 1992
70.112 bln
-1.281 bln
-1.79%
jan 1, 1993
69.936 bln
-176.174 mln
-0.25%
jan 1, 1994
51.472 bln
-18.464 bln
-26.4%
jan 1, 1995
57.674 bln
+6.202 bln
12.05%
jan 1, 1996
72.284 bln
+14.61 bln
25.33%
jan 1, 1997
76.727 bln
+4.444 bln
6.15%
jan 1, 1998
70.897 bln
-5.83 bln
-7.6%
jan 1, 1999
71.73 bln
+832.758 mln
1.17%
jan 1, 2000
71.618 bln
-111.79 mln
-0.16%
jan 1, 2001
69.73 bln
-1.889 bln
-2.64%
jan 1, 2002
63.403 bln
-6.327 bln
-9.07%
jan 1, 2003
68.725 bln
+5.322 bln
8.39%
jan 1, 2004
85.37 bln
+16.645 bln
24.22%
jan 1, 2005
100.063 bln
+14.694 bln
17.21%
jan 1, 2006
101.643 bln
+1.579 bln
1.58%
jan 1, 2007
111.646 bln
+10.003 bln
9.84%
jan 1, 2008
130.439 bln
+18.794 bln
16.83%
jan 1, 2009
132.87 bln
+2.43 bln
1.86%
jan 1, 2010
101.555 bln
-31.315 bln
-23.57%
jan 1, 2011
124.224 bln
+22.67 bln
22.32%
jan 1, 2012
140.162 bln
+15.937 bln
12.83%
jan 1, 2013
129.141 bln
-11.021 bln
-7.86%
jan 1, 2014
133.466 bln
+4.325 bln
3.35%
jan 1, 2015
130.839 bln
-2.626 bln
-1.97%
jan 1, 2016
115.27 bln
-15.569 bln
-11.9%
Ranking of countries by current statistics by years


Comments: