29
/
en
AIzaSyAYiBZKx7MnpbEhh9jyipgxe19OcubqV5w
April 1, 2024
216581
Pakistan
PAK
true
2
1
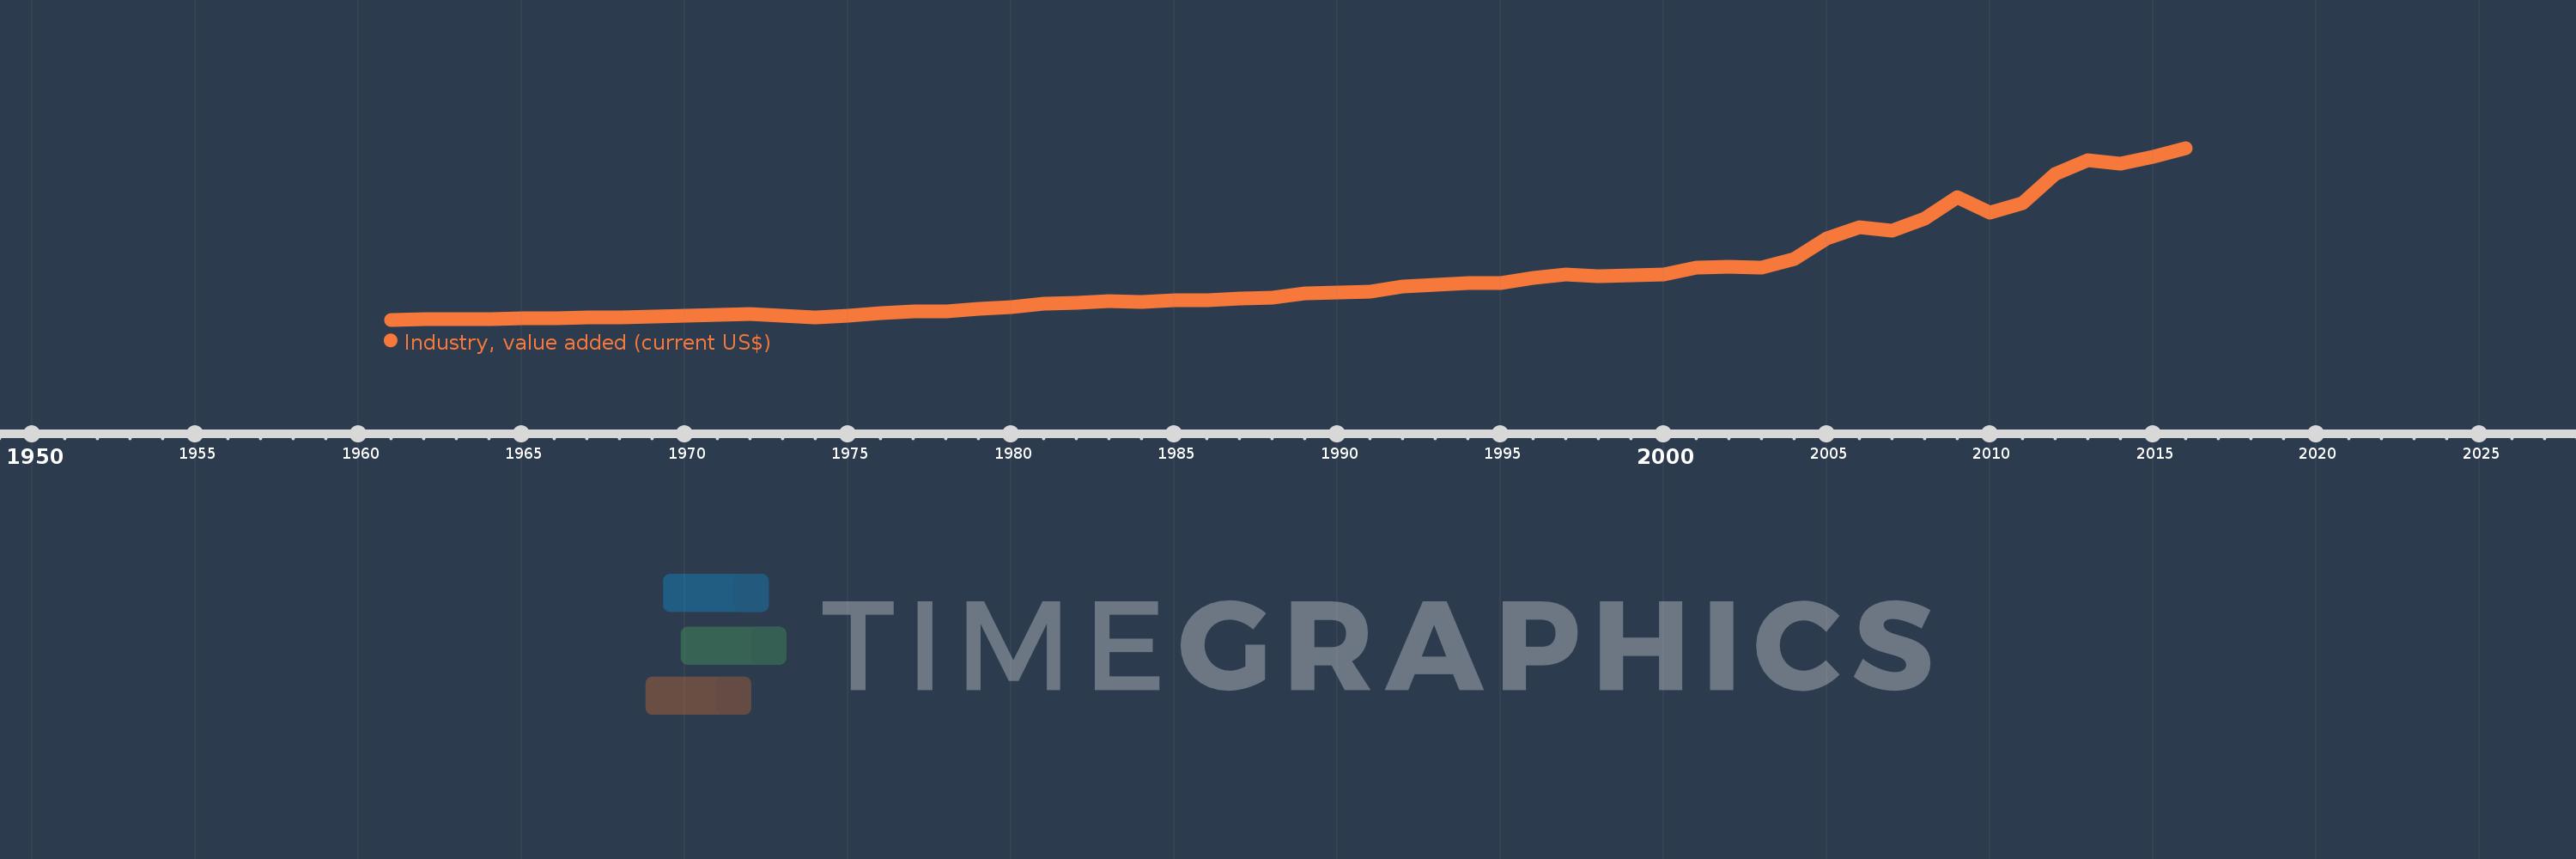
Industry, value added (current US$)
2016,2015,2014,2013,2012,2011,2010,2009,2008,2007,2006,2005,2004,2003,2002,2001,2000,1999,1998,1997,1996,1995,1994,1993,1992,1991,1990,1989,1988,1987,1986,1985,1984,1983,1982,1981,1980,1979,1978,1977,1976,1975,1974,1973,1972,1971,1970,1969,1968,1967,1966,1965,1964,1963,1962,1961
This statistics in other country:
AfghanistanAlbaniaAlgeriaAndorraAngolaAntigua and BarbudaArab WorldArgentinaArmeniaArubaAustraliaAustriaAzerbaijanBahamas, TheBahrainBangladeshBarbadosBelarusBelgiumBelizeBeninBermudaBhutanBoliviaBosnia and HerzegovinaBotswanaBrazilBrunei DarussalamBulgariaBurkina FasoBurundiCabo VerdeCambodiaCameroonCanadaCaribbean small statesCayman IslandsCentral African RepublicCentral Europe and the BalticsChadChileChinaColombiaComorosCongo, Dem. Rep.Congo, Rep.Costa RicaCote d'IvoireCroatiaCubaCyprusCzech RepublicDenmarkDjiboutiDominicaDominican RepublicEarly-demographic dividendEast Asia & PacificEast Asia & Pacific (excluding high income)East Asia & Pacific (IDA & IBRD countries)EcuadorEgypt, Arab Rep.El SalvadorEquatorial GuineaEritreaEstoniaEthiopiaEuro areaEurope & Central AsiaEurope & Central Asia (excluding high income)Europe & Central Asia (IDA & IBRD countries)European UnionFijiFinlandFragile and conflict affected situationsFranceGabonGambia, TheGeorgiaGermanyGhanaGreeceGrenadaGuatemalaGuineaGuinea-BissauGuyanaHeavily indebted poor countries (HIPC)High incomeHondurasHong Kong SAR, ChinaHungaryIBRD onlyIcelandIDA & IBRD totalIDA blendIDA onlyIDA totalIndiaIndonesiaIran, Islamic Rep.IraqIrelandItalyJamaicaJapanJordanKazakhstanKenyaKiribatiKorea, Rep.KosovoKuwaitKyrgyz RepublicLao PDRLate-demographic dividendLatin America & Caribbean Latin America & Caribbean (excluding high income)Latin America & the Caribbean (IDA & IBRD countries)LatviaLeast developed countries: UN classificationLebanonLesothoLiberiaLibyaLiechtensteinLithuaniaLow & middle incomeLow incomeLower middle incomeLuxembourgMacao SAR, ChinaMacedonia, FYRMadagascarMalawiMalaysiaMaldivesMaliMaltaMarshall IslandsMauritaniaMauritiusMexicoMicronesia, Fed. Sts.Middle East & North AfricaMiddle East & North Africa (excluding high income)Middle East & North Africa (IDA & IBRD countries)Middle incomeMoldovaMongoliaMontenegroMoroccoMozambiqueMyanmarNamibiaNepalNetherlandsNew CaledoniaNew ZealandNicaraguaNigerNigeriaNorth AmericaNorwayOECD membersOmanOther small statesPacific island small statesPakistanPalauPanamaPapua New GuineaParaguayPeruPhilippinesPolandPortugalPost-demographic dividendPre-demographic dividendPuerto RicoQatarRomaniaRussian FederationRwandaSamoaSao Tome and PrincipeSaudi ArabiaSenegalSerbiaSeychellesSierra LeoneSingaporeSlovak RepublicSloveniaSmall statesSolomon IslandsSouth AfricaSouth AsiaSouth Asia (IDA & IBRD)SpainSri LankaSt. Kitts and NevisSt. LuciaSt. Vincent and the GrenadinesSub-Saharan Africa Sub-Saharan Africa (excluding high income)Sub-Saharan Africa (IDA & IBRD countries)SudanSurinameSwazilandSwedenSwitzerlandSyrian Arab RepublicTajikistanTanzaniaThailandTimor-LesteTogoTongaTrinidad and TobagoTunisiaTurkeyTurkmenistanTuvaluUgandaUkraineUnited Arab EmiratesUnited KingdomUnited StatesUpper middle incomeUruguayUzbekistanVanuatuVenezuela, RBVietnamWest Bank and GazaWorldYemen, Rep.ZambiaZimbabwe Timeline:
This timeline shows a graph from 1961 to 2016 of Pakistan. No data until 1960. Number of actual observations by date: 56.
Source name:
World Development Indicators
Source organization:
World Bank national accounts data, and OECD National Accounts data files.
Categories, topics:
Economy & Growth
Last updated:
apr 23, 2017
Indicators value changes by year
Minimum:
546.409 mln
jan 1, 1961
Maximum:
51.437 bln
jan 1, 2016
At the date of observation
Value
Absolute change
Change from previous value
jan 1, 1961
546.409 mln
+546.409 mln
0.0%
jan 1, 1962
640.487 mln
+94.078 mln
17.22%
jan 1, 1963
713.565 mln
+73.078 mln
11.41%
jan 1, 1964
838.303 mln
+124.737 mln
17.48%
jan 1, 1965
976.48 mln
+138.177 mln
16.48%
jan 1, 1966
1.092 bln
+115.918 mln
11.87%
jan 1, 1967
1.234 bln
+141.957 mln
13.0%
jan 1, 1968
1.331 bln
+96.808 mln
7.84%
jan 1, 1969
1.453 bln
+121.378 mln
9.12%
jan 1, 1970
1.724 bln
+271.944 mln
18.72%
jan 1, 1971
2.032 bln
+307.224 mln
17.82%
jan 1, 1972
2.22 bln
+188.786 mln
9.29%
jan 1, 1973
1.83 bln
-390.463 mln
-17.58%
jan 1, 1974
1.261 bln
-568.896 mln
-31.09%
jan 1, 1975
1.782 bln
+520.883 mln
41.3%
jan 1, 1976
2.478 bln
+695.96 mln
39.05%
jan 1, 1977
2.977 bln
+499.192 mln
20.15%
jan 1, 1978
3.141 bln
+164.141 mln
5.51%
jan 1, 1979
3.683 bln
+541.717 mln
17.24%
jan 1, 1980
4.244 bln
+560.606 mln
15.22%
jan 1, 1981
5.302 bln
+1.058 bln
24.93%
jan 1, 1982
5.658 bln
+356.162 mln
6.72%
jan 1, 1983
6.163 bln
+505.154 mln
8.93%
jan 1, 1984
5.708 bln
-455.002 mln
-7.38%
jan 1, 1985
6.308 bln
+599.478 mln
10.5%
jan 1, 1986
6.299 bln
-8.038 mln
-0.13%
jan 1, 1987
6.751 bln
+451.923 mln
7.17%
jan 1, 1988
7.212 bln
+460.956 mln
6.83%
jan 1, 1989
8.345 bln
+1.133 bln
15.71%
jan 1, 1990
8.517 bln
+171.788 mln
2.06%
jan 1, 1991
8.947 bln
+429.863 mln
5.05%
jan 1, 1992
10.289 bln
+1.342 bln
15.0%
jan 1, 1993
10.82 bln
+531.47 mln
5.17%
jan 1, 1994
11.374 bln
+553.13 mln
5.11%
jan 1, 1995
11.3 bln
-74.004 mln
-0.65%
jan 1, 1996
12.93 bln
+1.63 bln
14.43%
jan 1, 1997
13.927 bln
+997.275 mln
7.71%
jan 1, 1998
13.459 bln
-467.95 mln
-3.36%
jan 1, 1999
13.715 bln
+256.283 mln
1.9%
jan 1, 2000
13.919 bln
+204.016 mln
1.49%
jan 1, 2001
16.059 bln
+2.14 bln
15.37%
jan 1, 2002
16.185 bln
+125.283 mln
0.78%
jan 1, 2003
16.066 bln
-118.448 mln
-0.73%
jan 1, 2004
18.506 bln
+2.44 bln
15.19%
jan 1, 2005
24.613 bln
+6.107 bln
33.0%
jan 1, 2006
27.954 bln
+3.341 bln
13.57%
jan 1, 2007
27.0 bln
-953.563 mln
-3.41%
jan 1, 2008
30.448 bln
+3.448 bln
12.77%
jan 1, 2009
36.97 bln
+6.522 bln
21.42%
jan 1, 2010
32.271 bln
-4.699 bln
-12.71%
jan 1, 2011
34.984 bln
+2.713 bln
8.41%
jan 1, 2012
43.789 bln
+8.806 bln
25.17%
jan 1, 2013
47.791 bln
+4.002 bln
9.14%
jan 1, 2014
46.745 bln
-1.046 bln
-2.19%
jan 1, 2015
48.934 bln
+2.188 bln
4.68%
jan 1, 2016
51.437 bln
+2.503 bln
5.12%
Ranking of countries by current statistics by years


Comments: