29
/
en
AIzaSyAYiBZKx7MnpbEhh9jyipgxe19OcubqV5w
April 1, 2024
124945
Egypt, Arab Rep.
EGY
true
2
1
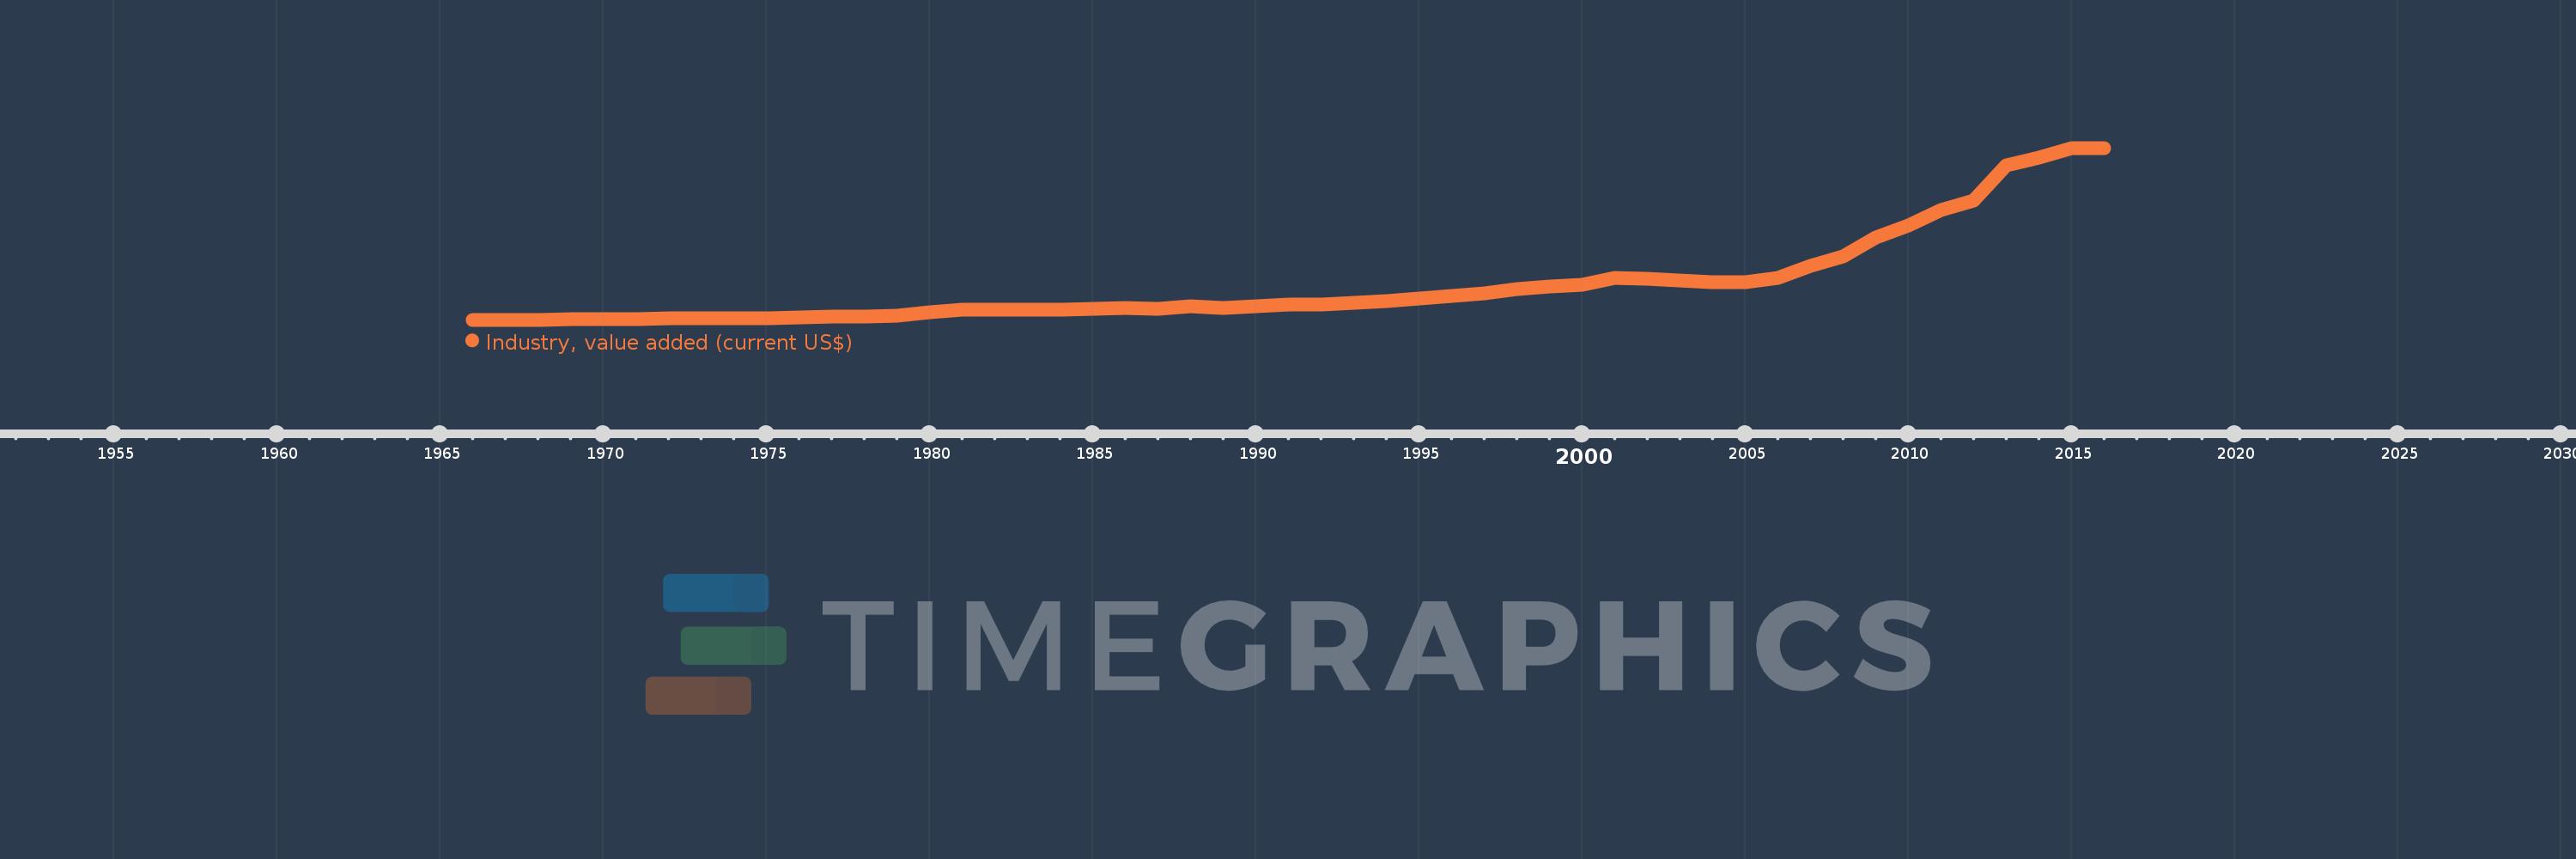
Industry, value added (current US$)
2016,2015,2014,2013,2012,2011,2010,2009,2008,2007,2006,2005,2004,2003,2002,2001,2000,1999,1998,1997,1996,1995,1994,1993,1992,1991,1990,1989,1988,1987,1986,1985,1984,1983,1982,1981,1980,1979,1978,1977,1976,1975,1974,1973,1972,1971,1970,1969,1968,1967,1966
This statistics in other country:
AfghanistanAlbaniaAlgeriaAndorraAngolaAntigua and BarbudaArab WorldArgentinaArmeniaArubaAustraliaAustriaAzerbaijanBahamas, TheBahrainBangladeshBarbadosBelarusBelgiumBelizeBeninBermudaBhutanBoliviaBosnia and HerzegovinaBotswanaBrazilBrunei DarussalamBulgariaBurkina FasoBurundiCabo VerdeCambodiaCameroonCanadaCaribbean small statesCayman IslandsCentral African RepublicCentral Europe and the BalticsChadChileChinaColombiaComorosCongo, Dem. Rep.Congo, Rep.Costa RicaCote d'IvoireCroatiaCubaCyprusCzech RepublicDenmarkDjiboutiDominicaDominican RepublicEarly-demographic dividendEast Asia & PacificEast Asia & Pacific (excluding high income)East Asia & Pacific (IDA & IBRD countries)EcuadorEgypt, Arab Rep.El SalvadorEquatorial GuineaEritreaEstoniaEthiopiaEuro areaEurope & Central AsiaEurope & Central Asia (excluding high income)Europe & Central Asia (IDA & IBRD countries)European UnionFijiFinlandFragile and conflict affected situationsFranceGabonGambia, TheGeorgiaGermanyGhanaGreeceGrenadaGuatemalaGuineaGuinea-BissauGuyanaHeavily indebted poor countries (HIPC)High incomeHondurasHong Kong SAR, ChinaHungaryIBRD onlyIcelandIDA & IBRD totalIDA blendIDA onlyIDA totalIndiaIndonesiaIran, Islamic Rep.IraqIrelandItalyJamaicaJapanJordanKazakhstanKenyaKiribatiKorea, Rep.KosovoKuwaitKyrgyz RepublicLao PDRLate-demographic dividendLatin America & Caribbean Latin America & Caribbean (excluding high income)Latin America & the Caribbean (IDA & IBRD countries)LatviaLeast developed countries: UN classificationLebanonLesothoLiberiaLibyaLiechtensteinLithuaniaLow & middle incomeLow incomeLower middle incomeLuxembourgMacao SAR, ChinaMacedonia, FYRMadagascarMalawiMalaysiaMaldivesMaliMaltaMarshall IslandsMauritaniaMauritiusMexicoMicronesia, Fed. Sts.Middle East & North AfricaMiddle East & North Africa (excluding high income)Middle East & North Africa (IDA & IBRD countries)Middle incomeMoldovaMongoliaMontenegroMoroccoMozambiqueMyanmarNamibiaNepalNetherlandsNew CaledoniaNew ZealandNicaraguaNigerNigeriaNorth AmericaNorwayOECD membersOmanOther small statesPacific island small statesPakistanPalauPanamaPapua New GuineaParaguayPeruPhilippinesPolandPortugalPost-demographic dividendPre-demographic dividendPuerto RicoQatarRomaniaRussian FederationRwandaSamoaSao Tome and PrincipeSaudi ArabiaSenegalSerbiaSeychellesSierra LeoneSingaporeSlovak RepublicSloveniaSmall statesSolomon IslandsSouth AfricaSouth AsiaSouth Asia (IDA & IBRD)SpainSri LankaSt. Kitts and NevisSt. LuciaSt. Vincent and the GrenadinesSub-Saharan Africa Sub-Saharan Africa (excluding high income)Sub-Saharan Africa (IDA & IBRD countries)SudanSurinameSwazilandSwedenSwitzerlandSyrian Arab RepublicTajikistanTanzaniaThailandTimor-LesteTogoTongaTrinidad and TobagoTunisiaTurkeyTurkmenistanTuvaluUgandaUkraineUnited Arab EmiratesUnited KingdomUnited StatesUpper middle incomeUruguayUzbekistanVanuatuVenezuela, RBVietnamWest Bank and GazaWorldYemen, Rep.ZambiaZimbabwe Timeline:
This timeline shows a graph from 1966 to 2016 of Egypt, Arab Rep.. No data until 1965. Number of actual observations by date: 51.
Source name:
World Development Indicators
Source organization:
World Bank national accounts data, and OECD National Accounts data files.
Categories, topics:
Economy & Growth
Last updated:
apr 23, 2017
Indicators value changes by year
Minimum:
1.223 bln
jan 1, 1966
Maximum:
121.877 bln
jan 1, 2015
At the date of observation
Value
Absolute change
Change from previous value
jan 1, 1966
1.223 bln
+1.223 bln
0.0%
jan 1, 1967
1.271 bln
+47.862 mln
3.91%
jan 1, 1968
1.298 bln
+27.431 mln
2.16%
jan 1, 1969
1.433 bln
+135.313 mln
10.42%
jan 1, 1970
1.643 bln
+209.93 mln
14.65%
jan 1, 1971
1.859 bln
+215.739 mln
13.13%
jan 1, 1972
2.007 bln
+148.315 mln
7.98%
jan 1, 1973
2.078 bln
+70.163 mln
3.5%
jan 1, 1974
2.154 bln
+76.053 mln
3.66%
jan 1, 1975
2.186 bln
+32.134 mln
1.49%
jan 1, 1976
2.981 bln
+795.402 mln
36.39%
jan 1, 1977
3.208 bln
+226.399 mln
7.59%
jan 1, 1978
3.598 bln
+390.067 mln
12.16%
jan 1, 1979
3.916 bln
+318.395 mln
8.85%
jan 1, 1980
6.196 bln
+2.28 bln
58.21%
jan 1, 1981
8.04 bln
+1.845 bln
29.77%
jan 1, 1982
8.439 bln
+398.911 mln
4.96%
jan 1, 1983
8.031 bln
-408.401 mln
-4.84%
jan 1, 1984
8.114 bln
+83.298 mln
1.04%
jan 1, 1985
8.626 bln
+512.016 mln
6.31%
jan 1, 1986
9.554 bln
+927.872 mln
10.76%
jan 1, 1987
9.088 bln
-466.041 mln
-4.88%
jan 1, 1988
10.495 bln
+1.407 bln
15.48%
jan 1, 1989
9.602 bln
-892.963 mln
-8.51%
jan 1, 1990
10.571 bln
+969.114 mln
10.09%
jan 1, 1991
11.779 bln
+1.208 bln
11.43%
jan 1, 1992
12.014 bln
+235.134 mln
2.0%
jan 1, 1993
13.147 bln
+1.134 bln
9.43%
jan 1, 1994
14.508 bln
+1.36 bln
10.35%
jan 1, 1995
15.83 bln
+1.323 bln
9.12%
jan 1, 1996
18.195 bln
+2.365 bln
14.94%
jan 1, 1997
19.963 bln
+1.768 bln
9.72%
jan 1, 1998
22.746 bln
+2.783 bln
13.94%
jan 1, 1999
24.299 bln
+1.553 bln
6.83%
jan 1, 2000
25.763 bln
+1.463 bln
6.02%
jan 1, 2001
30.702 bln
+4.94 bln
19.17%
jan 1, 2002
30.167 bln
-535.042 mln
-1.74%
jan 1, 2003
28.625 bln
-1.542 bln
-5.11%
jan 1, 2004
27.672 bln
-952.438 mln
-3.33%
jan 1, 2005
27.334 bln
-338.41 mln
-1.22%
jan 1, 2006
30.627 bln
+3.293 bln
12.05%
jan 1, 2007
38.861 bln
+8.234 bln
26.89%
jan 1, 2008
45.753 bln
+6.892 bln
17.74%
jan 1, 2009
58.961 bln
+13.208 bln
28.87%
jan 1, 2010
67.687 bln
+8.726 bln
14.8%
jan 1, 2011
78.328 bln
+10.641 bln
15.72%
jan 1, 2012
84.847 bln
+6.519 bln
8.32%
jan 1, 2013
109.657 bln
+24.811 bln
29.24%
jan 1, 2014
115.108 bln
+5.451 bln
4.97%
jan 1, 2015
121.877 bln
+6.769 bln
5.88%
jan 1, 2016
121.582 bln
-294.703 mln
-0.24%
Ranking of countries by current statistics by years


Comments: