29
/
en
AIzaSyAYiBZKx7MnpbEhh9jyipgxe19OcubqV5w
April 1, 2024
174260
Lao PDR
LAO
true
2
1
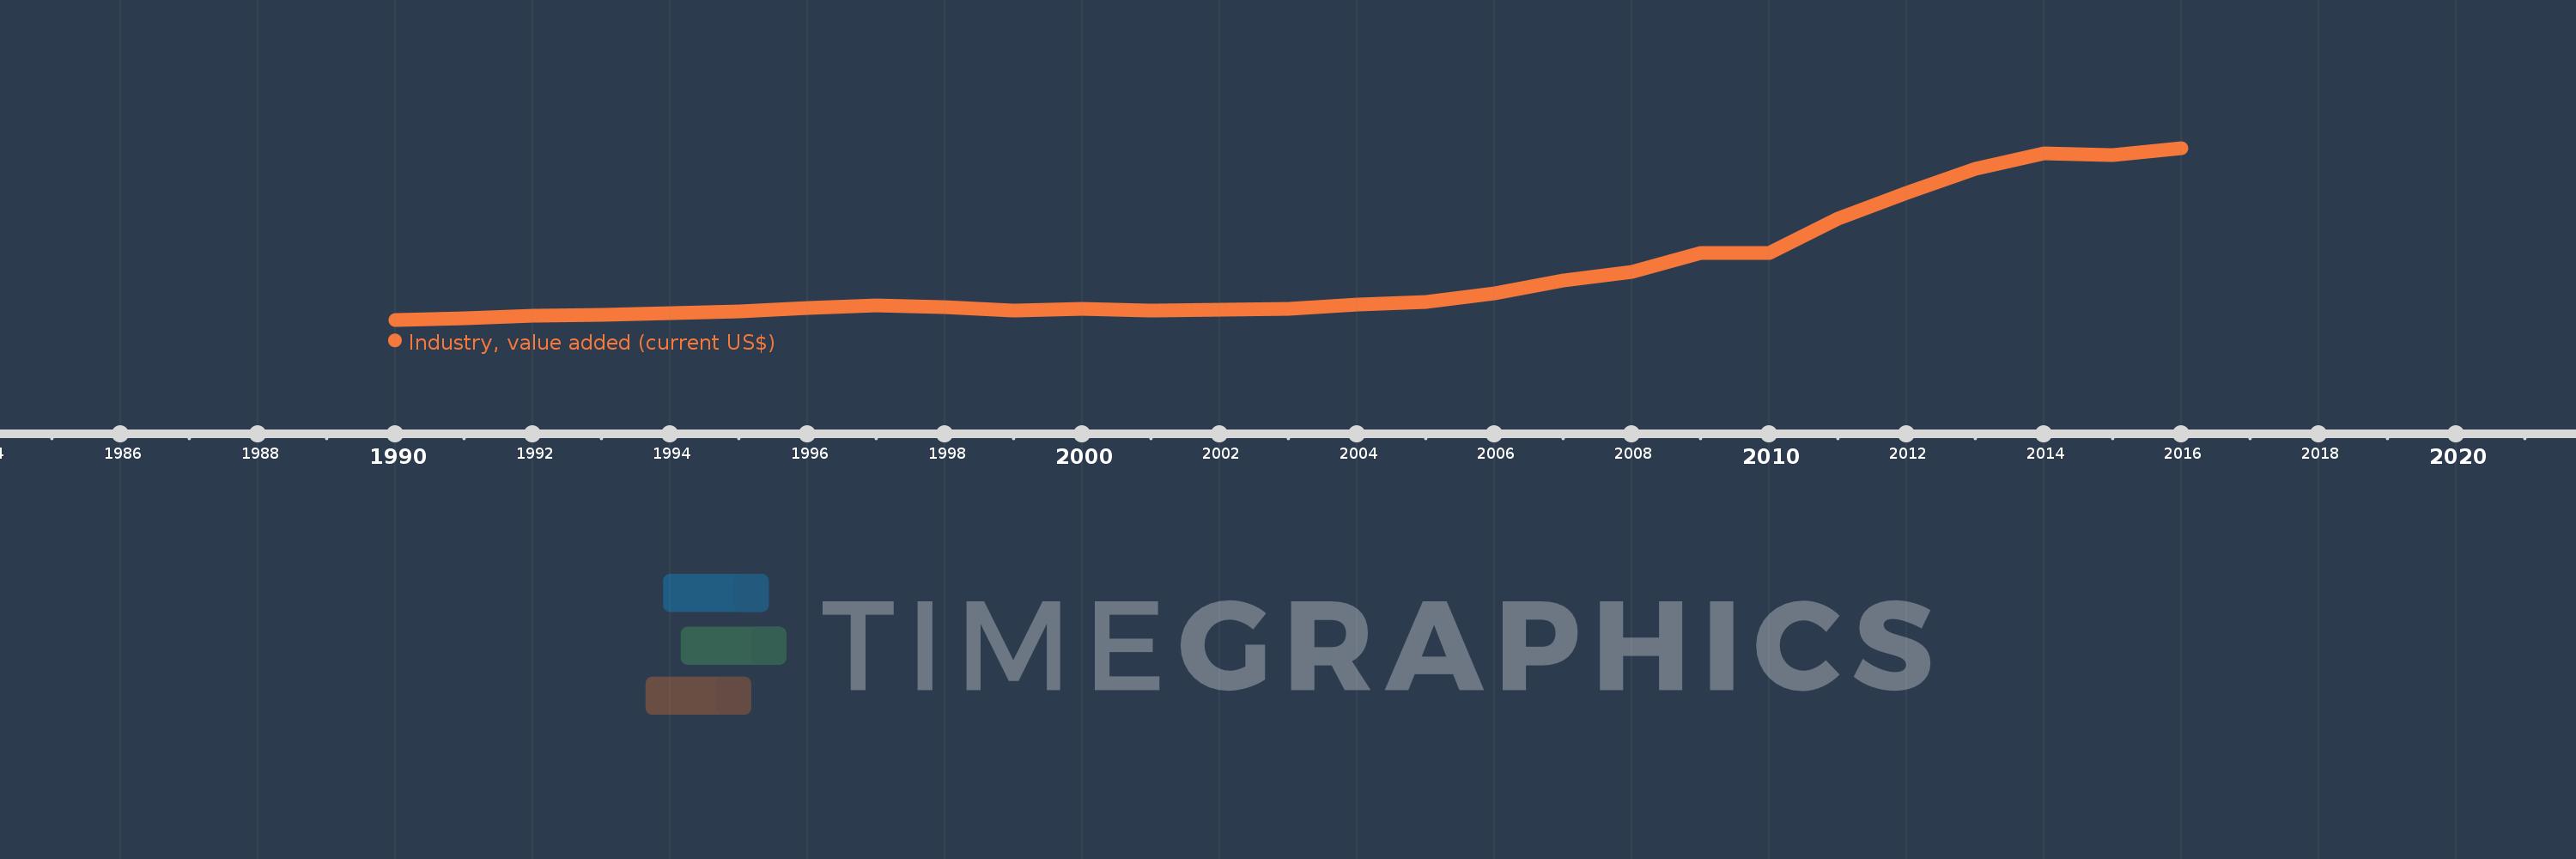
Industry, value added (current US$)
2016,2015,2014,2013,2012,2011,2010,2009,2008,2007,2006,2005,2004,2003,2002,2001,2000,1999,1998,1997,1996,1995,1994,1993,1992,1991,1990
This statistics in other country:
AfghanistanAlbaniaAlgeriaAndorraAngolaAntigua and BarbudaArab WorldArgentinaArmeniaArubaAustraliaAustriaAzerbaijanBahamas, TheBahrainBangladeshBarbadosBelarusBelgiumBelizeBeninBermudaBhutanBoliviaBosnia and HerzegovinaBotswanaBrazilBrunei DarussalamBulgariaBurkina FasoBurundiCabo VerdeCambodiaCameroonCanadaCaribbean small statesCayman IslandsCentral African RepublicCentral Europe and the BalticsChadChileChinaColombiaComorosCongo, Dem. Rep.Congo, Rep.Costa RicaCote d'IvoireCroatiaCubaCyprusCzech RepublicDenmarkDjiboutiDominicaDominican RepublicEarly-demographic dividendEast Asia & PacificEast Asia & Pacific (excluding high income)East Asia & Pacific (IDA & IBRD countries)EcuadorEgypt, Arab Rep.El SalvadorEquatorial GuineaEritreaEstoniaEthiopiaEuro areaEurope & Central AsiaEurope & Central Asia (excluding high income)Europe & Central Asia (IDA & IBRD countries)European UnionFijiFinlandFragile and conflict affected situationsFranceGabonGambia, TheGeorgiaGermanyGhanaGreeceGrenadaGuatemalaGuineaGuinea-BissauGuyanaHeavily indebted poor countries (HIPC)High incomeHondurasHong Kong SAR, ChinaHungaryIBRD onlyIcelandIDA & IBRD totalIDA blendIDA onlyIDA totalIndiaIndonesiaIran, Islamic Rep.IraqIrelandItalyJamaicaJapanJordanKazakhstanKenyaKiribatiKorea, Rep.KosovoKuwaitKyrgyz RepublicLao PDRLate-demographic dividendLatin America & Caribbean Latin America & Caribbean (excluding high income)Latin America & the Caribbean (IDA & IBRD countries)LatviaLeast developed countries: UN classificationLebanonLesothoLiberiaLibyaLiechtensteinLithuaniaLow & middle incomeLow incomeLower middle incomeLuxembourgMacao SAR, ChinaMacedonia, FYRMadagascarMalawiMalaysiaMaldivesMaliMaltaMarshall IslandsMauritaniaMauritiusMexicoMicronesia, Fed. Sts.Middle East & North AfricaMiddle East & North Africa (excluding high income)Middle East & North Africa (IDA & IBRD countries)Middle incomeMoldovaMongoliaMontenegroMoroccoMozambiqueMyanmarNamibiaNepalNetherlandsNew CaledoniaNew ZealandNicaraguaNigerNigeriaNorth AmericaNorwayOECD membersOmanOther small statesPacific island small statesPakistanPalauPanamaPapua New GuineaParaguayPeruPhilippinesPolandPortugalPost-demographic dividendPre-demographic dividendPuerto RicoQatarRomaniaRussian FederationRwandaSamoaSao Tome and PrincipeSaudi ArabiaSenegalSerbiaSeychellesSierra LeoneSingaporeSlovak RepublicSloveniaSmall statesSolomon IslandsSouth AfricaSouth AsiaSouth Asia (IDA & IBRD)SpainSri LankaSt. Kitts and NevisSt. LuciaSt. Vincent and the GrenadinesSub-Saharan Africa Sub-Saharan Africa (excluding high income)Sub-Saharan Africa (IDA & IBRD countries)SudanSurinameSwazilandSwedenSwitzerlandSyrian Arab RepublicTajikistanTanzaniaThailandTimor-LesteTogoTongaTrinidad and TobagoTunisiaTurkeyTurkmenistanTuvaluUgandaUkraineUnited Arab EmiratesUnited KingdomUnited StatesUpper middle incomeUruguayUzbekistanVanuatuVenezuela, RBVietnamWest Bank and GazaWorldYemen, Rep.ZambiaZimbabwe Timeline:
This timeline shows a graph from 1990 to 2016 of Lao PDR. No data until 1989. Number of actual observations by date: 27.
Source name:
World Development Indicators
Source organization:
World Bank national accounts data, and OECD National Accounts data files.
Categories, topics:
Economy & Growth
Last updated:
apr 23, 2017
Indicators value changes by year
Minimum:
95.881 mln
jan 1, 1990
Maximum:
3.612 bln
jan 1, 2016
At the date of observation
Value
Absolute change
Change from previous value
jan 1, 1990
95.881 mln
+95.881 mln
0.0%
jan 1, 1991
124.479 mln
+28.598 mln
29.83%
jan 1, 1992
170.493 mln
+46.014 mln
36.97%
jan 1, 1993
197.743 mln
+27.25 mln
15.98%
jan 1, 1994
231.623 mln
+33.88 mln
17.13%
jan 1, 1995
274.081 mln
+42.458 mln
18.33%
jan 1, 1996
330.86 mln
+56.779 mln
20.72%
jan 1, 1997
386.202 mln
+55.342 mln
16.73%
jan 1, 1998
360.323 mln
-25.879 mln
-6.7%
jan 1, 1999
284.993 mln
-75.33 mln
-20.91%
jan 1, 2000
326.808 mln
+41.815 mln
14.67%
jan 1, 2001
285.251 mln
-41.557 mln
-12.72%
jan 1, 2002
300.554 mln
+15.303 mln
5.36%
jan 1, 2003
323.2 mln
+22.646 mln
7.53%
jan 1, 2004
407.096 mln
+83.896 mln
25.96%
jan 1, 2005
458.123 mln
+51.027 mln
12.53%
jan 1, 2006
635.437 mln
+177.314 mln
38.7%
jan 1, 2007
903.808 mln
+268.37 mln
42.23%
jan 1, 2008
1.072 bln
+168.53 mln
18.65%
jan 1, 2009
1.467 bln
+394.782 mln
36.82%
jan 1, 2010
1.468 bln
+621.915K
0.04%
jan 1, 2011
2.172 bln
+703.813 mln
47.95%
jan 1, 2012
2.696 bln
+524.609 mln
24.16%
jan 1, 2013
3.179 bln
+482.47 mln
17.89%
jan 1, 2014
3.503 bln
+324.352 mln
10.2%
jan 1, 2015
3.471 bln
-31.771 mln
-0.91%
jan 1, 2016
3.612 bln
+140.556 mln
4.05%
Ranking of countries by current statistics by years


Comments: