29
/
en
AIzaSyAYiBZKx7MnpbEhh9jyipgxe19OcubqV5w
April 1, 2024
226849
Puerto Rico
PRI
true
2
1
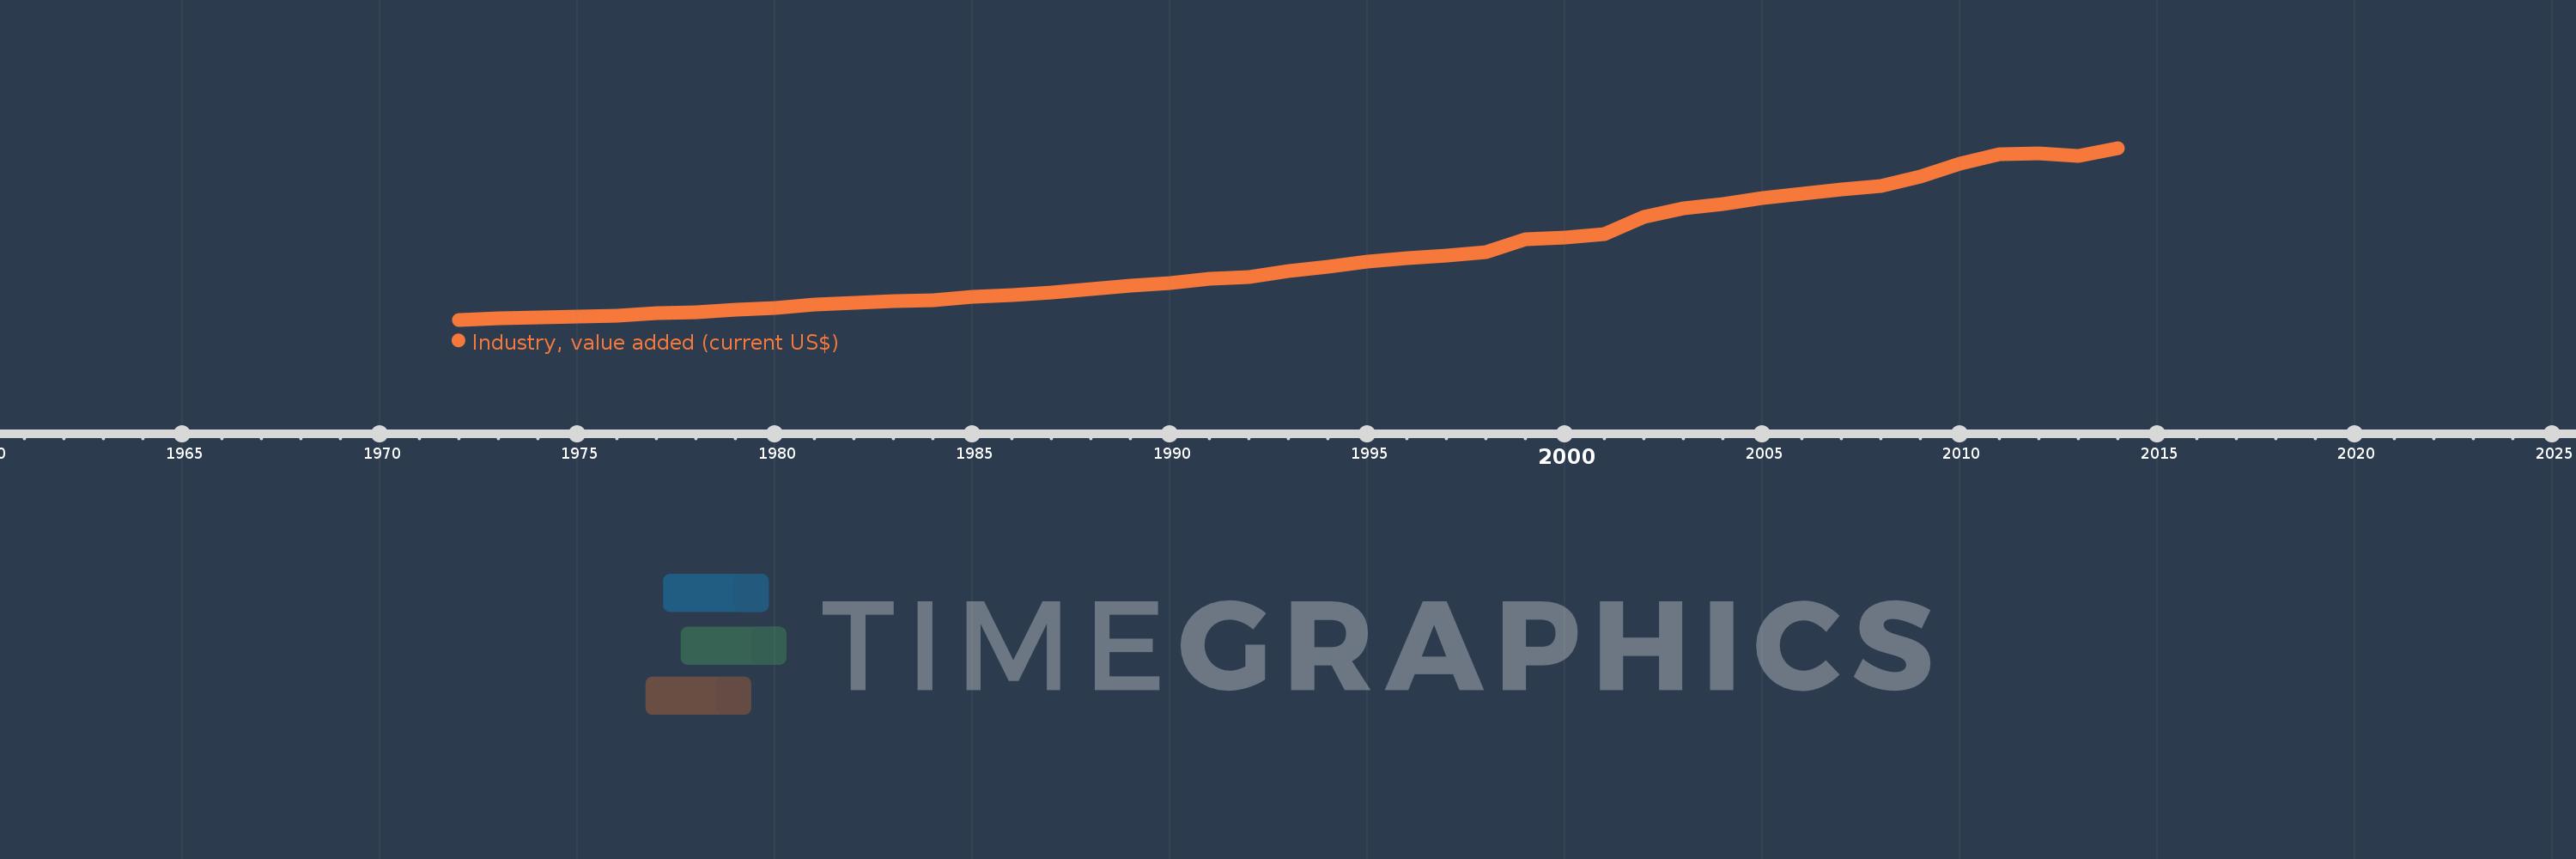
Industry, value added (current US$)
2014,2013,2012,2011,2010,2009,2008,2007,2006,2005,2004,2003,2002,2001,2000,1999,1998,1997,1996,1995,1994,1993,1992,1991,1990,1989,1988,1987,1986,1985,1984,1983,1982,1981,1980,1979,1978,1977,1976,1975,1974,1973,1972
This statistics in other country:
AfghanistanAlbaniaAlgeriaAndorraAngolaAntigua and BarbudaArab WorldArgentinaArmeniaArubaAustraliaAustriaAzerbaijanBahamas, TheBahrainBangladeshBarbadosBelarusBelgiumBelizeBeninBermudaBhutanBoliviaBosnia and HerzegovinaBotswanaBrazilBrunei DarussalamBulgariaBurkina FasoBurundiCabo VerdeCambodiaCameroonCanadaCaribbean small statesCayman IslandsCentral African RepublicCentral Europe and the BalticsChadChileChinaColombiaComorosCongo, Dem. Rep.Congo, Rep.Costa RicaCote d'IvoireCroatiaCubaCyprusCzech RepublicDenmarkDjiboutiDominicaDominican RepublicEarly-demographic dividendEast Asia & PacificEast Asia & Pacific (excluding high income)East Asia & Pacific (IDA & IBRD countries)EcuadorEgypt, Arab Rep.El SalvadorEquatorial GuineaEritreaEstoniaEthiopiaEuro areaEurope & Central AsiaEurope & Central Asia (excluding high income)Europe & Central Asia (IDA & IBRD countries)European UnionFijiFinlandFragile and conflict affected situationsFranceGabonGambia, TheGeorgiaGermanyGhanaGreeceGrenadaGuatemalaGuineaGuinea-BissauGuyanaHeavily indebted poor countries (HIPC)High incomeHondurasHong Kong SAR, ChinaHungaryIBRD onlyIcelandIDA & IBRD totalIDA blendIDA onlyIDA totalIndiaIndonesiaIran, Islamic Rep.IraqIrelandItalyJamaicaJapanJordanKazakhstanKenyaKiribatiKorea, Rep.KosovoKuwaitKyrgyz RepublicLao PDRLate-demographic dividendLatin America & Caribbean Latin America & Caribbean (excluding high income)Latin America & the Caribbean (IDA & IBRD countries)LatviaLeast developed countries: UN classificationLebanonLesothoLiberiaLibyaLiechtensteinLithuaniaLow & middle incomeLow incomeLower middle incomeLuxembourgMacao SAR, ChinaMacedonia, FYRMadagascarMalawiMalaysiaMaldivesMaliMaltaMarshall IslandsMauritaniaMauritiusMexicoMicronesia, Fed. Sts.Middle East & North AfricaMiddle East & North Africa (excluding high income)Middle East & North Africa (IDA & IBRD countries)Middle incomeMoldovaMongoliaMontenegroMoroccoMozambiqueMyanmarNamibiaNepalNetherlandsNew CaledoniaNew ZealandNicaraguaNigerNigeriaNorth AmericaNorwayOECD membersOmanOther small statesPacific island small statesPakistanPalauPanamaPapua New GuineaParaguayPeruPhilippinesPolandPortugalPost-demographic dividendPre-demographic dividendPuerto RicoQatarRomaniaRussian FederationRwandaSamoaSao Tome and PrincipeSaudi ArabiaSenegalSerbiaSeychellesSierra LeoneSingaporeSlovak RepublicSloveniaSmall statesSolomon IslandsSouth AfricaSouth AsiaSouth Asia (IDA & IBRD)SpainSri LankaSt. Kitts and NevisSt. LuciaSt. Vincent and the GrenadinesSub-Saharan Africa Sub-Saharan Africa (excluding high income)Sub-Saharan Africa (IDA & IBRD countries)SudanSurinameSwazilandSwedenSwitzerlandSyrian Arab RepublicTajikistanTanzaniaThailandTimor-LesteTogoTongaTrinidad and TobagoTunisiaTurkeyTurkmenistanTuvaluUgandaUkraineUnited Arab EmiratesUnited KingdomUnited StatesUpper middle incomeUruguayUzbekistanVanuatuVenezuela, RBVietnamWest Bank and GazaWorldYemen, Rep.ZambiaZimbabwe Timeline:
This timeline shows a graph from 1972 to 2014 of Puerto Rico. No data until 1971. Number of actual observations by date: 43.
Source name:
World Development Indicators
Source organization:
World Bank national accounts data, and OECD National Accounts data files.
Categories, topics:
Economy & Growth
Last updated:
apr 23, 2017
Indicators value changes by year
Minimum:
2.906 bln
jan 1, 1972
Maximum:
98.48 bln
jan 1, 2014
At the date of observation
Value
Absolute change
Change from previous value
jan 1, 1972
2.906 bln
+2.906 bln
0.0%
jan 1, 1973
3.48 bln
+573.72 mln
19.74%
jan 1, 1974
4.075 bln
+594.938 mln
17.1%
jan 1, 1975
4.763 bln
+688.837 mln
16.91%
jan 1, 1976
5.162 bln
+399.065 mln
8.38%
jan 1, 1977
6.377 bln
+1.215 bln
23.53%
jan 1, 1978
7.037 bln
+659.761 mln
10.35%
jan 1, 1979
8.272 bln
+1.235 bln
17.56%
jan 1, 1980
9.425 bln
+1.153 bln
13.93%
jan 1, 1981
11.245 bln
+1.82 bln
19.32%
jan 1, 1982
12.242 bln
+997.198 mln
8.87%
jan 1, 1983
13.054 bln
+811.967 mln
6.63%
jan 1, 1984
13.616 bln
+561.579 mln
4.3%
jan 1, 1985
15.584 bln
+1.969 bln
14.46%
jan 1, 1986
16.66 bln
+1.075 bln
6.9%
jan 1, 1987
18.012 bln
+1.353 bln
8.12%
jan 1, 1988
19.986 bln
+1.974 bln
10.96%
jan 1, 1989
22.103 bln
+2.117 bln
10.59%
jan 1, 1990
23.383 bln
+1.28 bln
5.79%
jan 1, 1991
25.476 bln
+2.094 bln
8.95%
jan 1, 1992
26.608 bln
+1.131 bln
4.44%
jan 1, 1993
29.773 bln
+3.165 bln
11.9%
jan 1, 1994
32.36 bln
+2.587 bln
8.69%
jan 1, 1995
35.041 bln
+2.681 bln
8.29%
jan 1, 1996
37.323 bln
+2.283 bln
6.51%
jan 1, 1997
38.67 bln
+1.347 bln
3.61%
jan 1, 1998
40.391 bln
+1.721 bln
4.45%
jan 1, 1999
47.914 bln
+7.522 bln
18.62%
jan 1, 2000
48.499 bln
+585.743 mln
1.22%
jan 1, 2001
50.316 bln
+1.816 bln
3.74%
jan 1, 2002
60.338 bln
+10.022 bln
19.92%
jan 1, 2003
64.862 bln
+4.524 bln
7.5%
jan 1, 2004
67.262 bln
+2.4 bln
3.7%
jan 1, 2005
70.649 bln
+3.388 bln
5.04%
jan 1, 2006
73.116 bln
+2.466 bln
3.49%
jan 1, 2007
75.554 bln
+2.438 bln
3.34%
jan 1, 2008
77.549 bln
+1.995 bln
2.64%
jan 1, 2009
82.642 bln
+5.093 bln
6.57%
jan 1, 2010
89.757 bln
+7.115 bln
8.61%
jan 1, 2011
95.17 bln
+5.413 bln
6.03%
jan 1, 2012
95.706 bln
+536.2 mln
0.56%
jan 1, 2013
94.115 bln
-1.592 bln
-1.66%
jan 1, 2014
98.48 bln
+4.366 bln
4.64%
Ranking of countries by current statistics by years


Comments: