29
/
en
AIzaSyAYiBZKx7MnpbEhh9jyipgxe19OcubqV5w
April 1, 2024
82935
Belize
BLZ
true
2
1
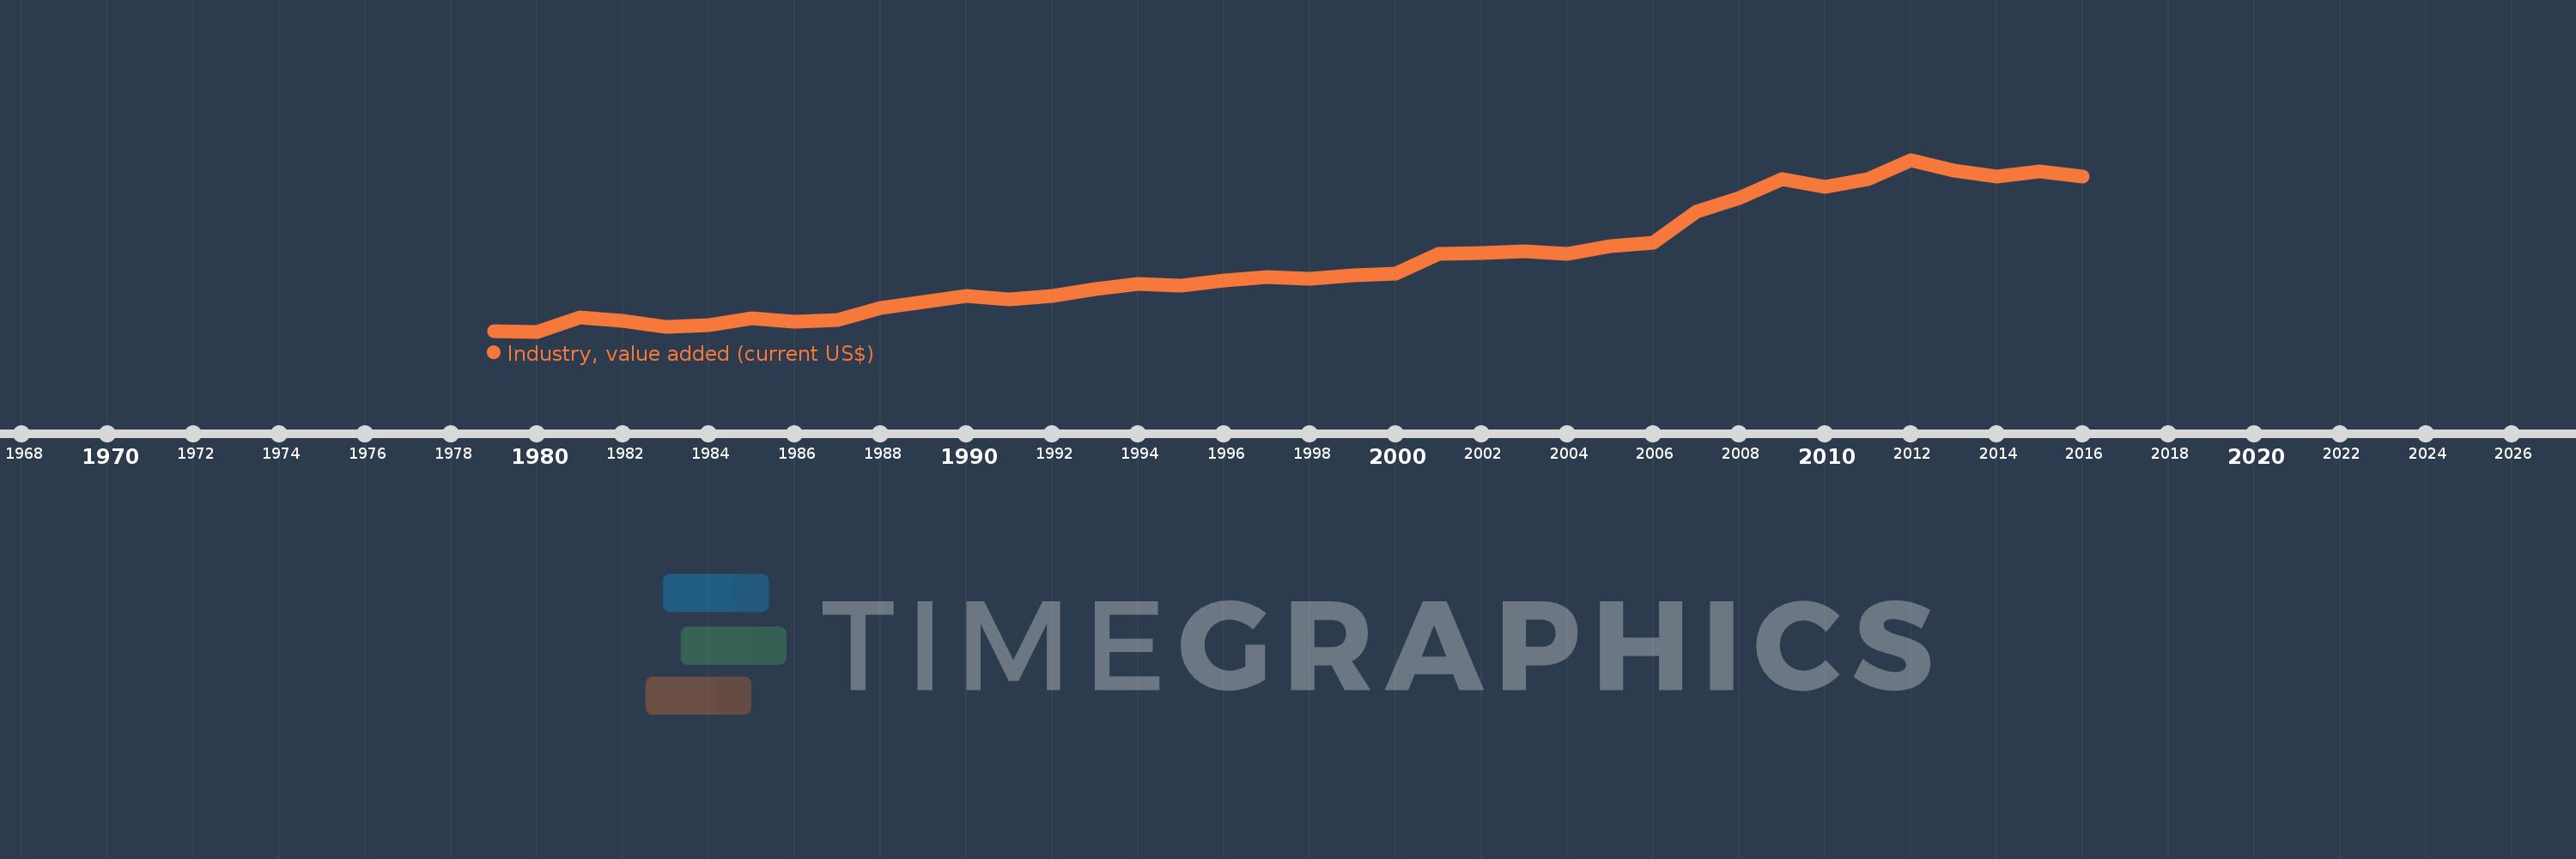
Industry, value added (current US$)
2016,2015,2014,2013,2012,2011,2010,2009,2008,2007,2006,2005,2004,2003,2002,2001,2000,1999,1998,1997,1996,1995,1994,1993,1992,1991,1990,1989,1988,1987,1986,1985,1984,1983,1982,1981,1980,1979
This statistics in other country:
AfghanistanAlbaniaAlgeriaAndorraAngolaAntigua and BarbudaArab WorldArgentinaArmeniaArubaAustraliaAustriaAzerbaijanBahamas, TheBahrainBangladeshBarbadosBelarusBelgiumBelizeBeninBermudaBhutanBoliviaBosnia and HerzegovinaBotswanaBrazilBrunei DarussalamBulgariaBurkina FasoBurundiCabo VerdeCambodiaCameroonCanadaCaribbean small statesCayman IslandsCentral African RepublicCentral Europe and the BalticsChadChileChinaColombiaComorosCongo, Dem. Rep.Congo, Rep.Costa RicaCote d'IvoireCroatiaCubaCyprusCzech RepublicDenmarkDjiboutiDominicaDominican RepublicEarly-demographic dividendEast Asia & PacificEast Asia & Pacific (excluding high income)East Asia & Pacific (IDA & IBRD countries)EcuadorEgypt, Arab Rep.El SalvadorEquatorial GuineaEritreaEstoniaEthiopiaEuro areaEurope & Central AsiaEurope & Central Asia (excluding high income)Europe & Central Asia (IDA & IBRD countries)European UnionFijiFinlandFragile and conflict affected situationsFranceGabonGambia, TheGeorgiaGermanyGhanaGreeceGrenadaGuatemalaGuineaGuinea-BissauGuyanaHeavily indebted poor countries (HIPC)High incomeHondurasHong Kong SAR, ChinaHungaryIBRD onlyIcelandIDA & IBRD totalIDA blendIDA onlyIDA totalIndiaIndonesiaIran, Islamic Rep.IraqIrelandItalyJamaicaJapanJordanKazakhstanKenyaKiribatiKorea, Rep.KosovoKuwaitKyrgyz RepublicLao PDRLate-demographic dividendLatin America & Caribbean Latin America & Caribbean (excluding high income)Latin America & the Caribbean (IDA & IBRD countries)LatviaLeast developed countries: UN classificationLebanonLesothoLiberiaLibyaLiechtensteinLithuaniaLow & middle incomeLow incomeLower middle incomeLuxembourgMacao SAR, ChinaMacedonia, FYRMadagascarMalawiMalaysiaMaldivesMaliMaltaMarshall IslandsMauritaniaMauritiusMexicoMicronesia, Fed. Sts.Middle East & North AfricaMiddle East & North Africa (excluding high income)Middle East & North Africa (IDA & IBRD countries)Middle incomeMoldovaMongoliaMontenegroMoroccoMozambiqueMyanmarNamibiaNepalNetherlandsNew CaledoniaNew ZealandNicaraguaNigerNigeriaNorth AmericaNorwayOECD membersOmanOther small statesPacific island small statesPakistanPalauPanamaPapua New GuineaParaguayPeruPhilippinesPolandPortugalPost-demographic dividendPre-demographic dividendPuerto RicoQatarRomaniaRussian FederationRwandaSamoaSao Tome and PrincipeSaudi ArabiaSenegalSerbiaSeychellesSierra LeoneSingaporeSlovak RepublicSloveniaSmall statesSolomon IslandsSouth AfricaSouth AsiaSouth Asia (IDA & IBRD)SpainSri LankaSt. Kitts and NevisSt. LuciaSt. Vincent and the GrenadinesSub-Saharan Africa Sub-Saharan Africa (excluding high income)Sub-Saharan Africa (IDA & IBRD countries)SudanSurinameSwazilandSwedenSwitzerlandSyrian Arab RepublicTajikistanTanzaniaThailandTimor-LesteTogoTongaTrinidad and TobagoTunisiaTurkeyTurkmenistanTuvaluUgandaUkraineUnited Arab EmiratesUnited KingdomUnited StatesUpper middle incomeUruguayUzbekistanVanuatuVenezuela, RBVietnamWest Bank and GazaWorldYemen, Rep.ZambiaZimbabwe Timeline:
This timeline shows a graph from 1979 to 2016 of Belize. No data until 1978. Number of actual observations by date: 38.
Source name:
World Development Indicators
Source organization:
World Bank national accounts data, and OECD National Accounts data files.
Categories, topics:
Economy & Growth
Last updated:
apr 23, 2017
Indicators value changes by year
Minimum:
30.35 mln
jan 1, 1980
Maximum:
292.918 mln
jan 1, 2012
At the date of observation
Value
Absolute change
Change from previous value
jan 1, 1979
31.05 mln
+31.05 mln
0.0%
jan 1, 1980
30.35 mln
-700.0K
-2.25%
jan 1, 1981
52.55 mln
+22.2 mln
73.15%
jan 1, 1982
46.7 mln
-5.85 mln
-11.13%
jan 1, 1983
38.2 mln
-8.5 mln
-18.2%
jan 1, 1984
40.4 mln
+2.2 mln
5.76%
jan 1, 1985
50.15 mln
+9.75 mln
24.13%
jan 1, 1986
45.7 mln
-4.45 mln
-8.87%
jan 1, 1987
48.2 mln
+2.5 mln
5.47%
jan 1, 1988
66.15 mln
+17.95 mln
37.24%
jan 1, 1989
75.6 mln
+9.45 mln
14.29%
jan 1, 1990
85.25 mln
+9.65 mln
12.76%
jan 1, 1991
79.7 mln
-5.55 mln
-6.51%
jan 1, 1992
84.258 mln
+4.558 mln
5.72%
jan 1, 1993
95.271 mln
+11.013 mln
13.07%
jan 1, 1994
103.724 mln
+8.453 mln
8.87%
jan 1, 1995
100.603 mln
-3.121 mln
-3.01%
jan 1, 1996
108.172 mln
+7.569 mln
7.52%
jan 1, 1997
113.252 mln
+5.081 mln
4.7%
jan 1, 1998
110.992 mln
-2.261 mln
-2.0%
jan 1, 1999
115.755 mln
+4.764 mln
4.29%
jan 1, 2000
119.076 mln
+3.32 mln
2.87%
jan 1, 2001
149.726 mln
+30.65 mln
25.74%
jan 1, 2002
150.162 mln
+436.05K
0.29%
jan 1, 2003
153.677 mln
+3.515 mln
2.34%
jan 1, 2004
149.102 mln
-4.575 mln
-2.98%
jan 1, 2005
161.007 mln
+11.905 mln
7.98%
jan 1, 2006
166.797 mln
+5.79 mln
3.6%
jan 1, 2007
213.969 mln
+47.173 mln
28.28%
jan 1, 2008
233.995 mln
+20.026 mln
9.36%
jan 1, 2009
263.54 mln
+29.545 mln
12.63%
jan 1, 2010
251.826 mln
-11.714 mln
-4.44%
jan 1, 2011
263.096 mln
+11.27 mln
4.48%
jan 1, 2012
292.918 mln
+29.822 mln
11.34%
jan 1, 2013
276.327 mln
-16.591 mln
-5.66%
jan 1, 2014
267.685 mln
-8.642 mln
-3.13%
jan 1, 2015
274.696 mln
+7.011 mln
2.62%
jan 1, 2016
267.722 mln
-6.974 mln
-2.54%
Ranking of countries by current statistics by years


Comments: