29
/
en
AIzaSyAYiBZKx7MnpbEhh9jyipgxe19OcubqV5w
April 1, 2024
74053
Austria
AUT
true
2
1
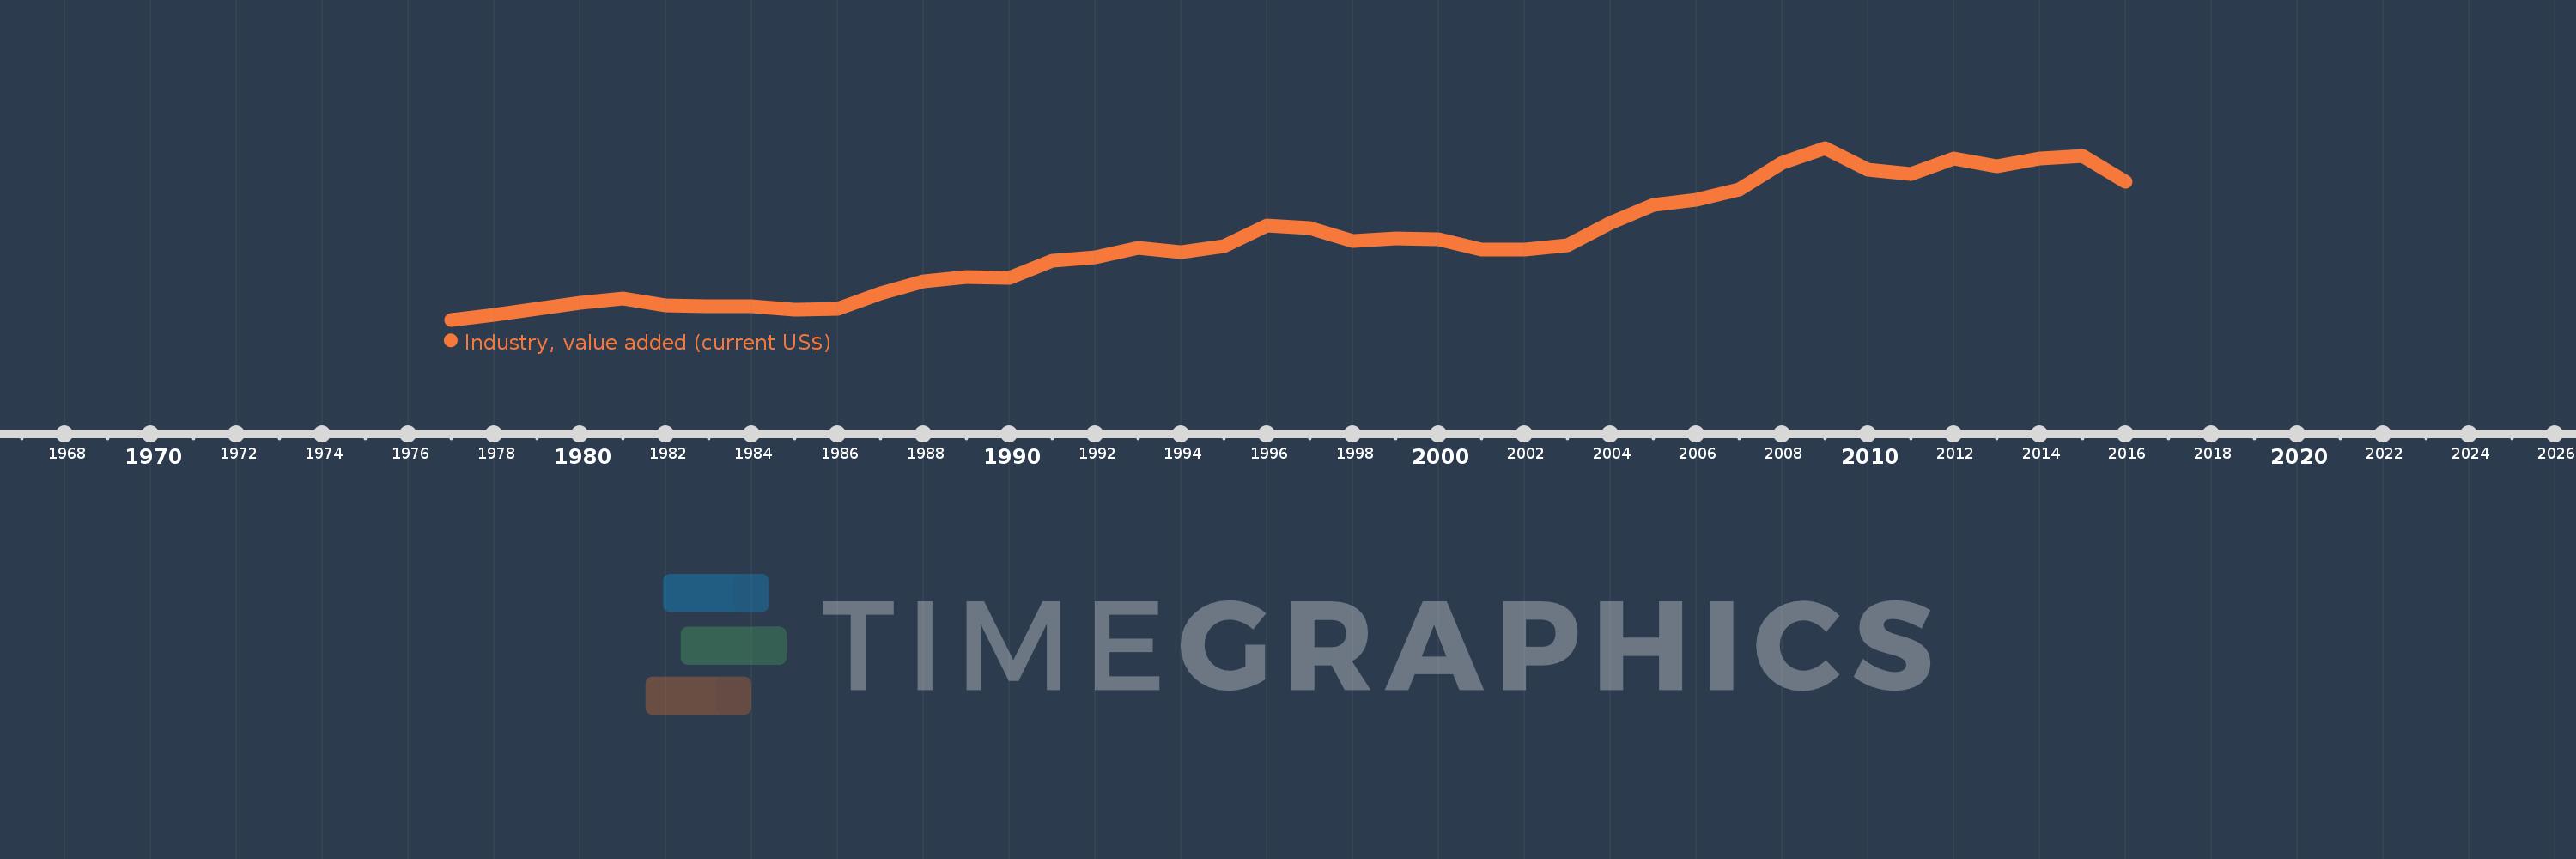
Industry, value added (current US$)
2016,2015,2014,2013,2012,2011,2010,2009,2008,2007,2006,2005,2004,2003,2002,2001,2000,1999,1998,1997,1996,1995,1994,1993,1992,1991,1990,1989,1988,1987,1986,1985,1984,1983,1982,1981,1980,1979,1978,1977
This statistics in other country:
AfghanistanAlbaniaAlgeriaAndorraAngolaAntigua and BarbudaArab WorldArgentinaArmeniaArubaAustraliaAustriaAzerbaijanBahamas, TheBahrainBangladeshBarbadosBelarusBelgiumBelizeBeninBermudaBhutanBoliviaBosnia and HerzegovinaBotswanaBrazilBrunei DarussalamBulgariaBurkina FasoBurundiCabo VerdeCambodiaCameroonCanadaCaribbean small statesCayman IslandsCentral African RepublicCentral Europe and the BalticsChadChileChinaColombiaComorosCongo, Dem. Rep.Congo, Rep.Costa RicaCote d'IvoireCroatiaCubaCyprusCzech RepublicDenmarkDjiboutiDominicaDominican RepublicEarly-demographic dividendEast Asia & PacificEast Asia & Pacific (excluding high income)East Asia & Pacific (IDA & IBRD countries)EcuadorEgypt, Arab Rep.El SalvadorEquatorial GuineaEritreaEstoniaEthiopiaEuro areaEurope & Central AsiaEurope & Central Asia (excluding high income)Europe & Central Asia (IDA & IBRD countries)European UnionFijiFinlandFragile and conflict affected situationsFranceGabonGambia, TheGeorgiaGermanyGhanaGreeceGrenadaGuatemalaGuineaGuinea-BissauGuyanaHeavily indebted poor countries (HIPC)High incomeHondurasHong Kong SAR, ChinaHungaryIBRD onlyIcelandIDA & IBRD totalIDA blendIDA onlyIDA totalIndiaIndonesiaIran, Islamic Rep.IraqIrelandItalyJamaicaJapanJordanKazakhstanKenyaKiribatiKorea, Rep.KosovoKuwaitKyrgyz RepublicLao PDRLate-demographic dividendLatin America & Caribbean Latin America & Caribbean (excluding high income)Latin America & the Caribbean (IDA & IBRD countries)LatviaLeast developed countries: UN classificationLebanonLesothoLiberiaLibyaLiechtensteinLithuaniaLow & middle incomeLow incomeLower middle incomeLuxembourgMacao SAR, ChinaMacedonia, FYRMadagascarMalawiMalaysiaMaldivesMaliMaltaMarshall IslandsMauritaniaMauritiusMexicoMicronesia, Fed. Sts.Middle East & North AfricaMiddle East & North Africa (excluding high income)Middle East & North Africa (IDA & IBRD countries)Middle incomeMoldovaMongoliaMontenegroMoroccoMozambiqueMyanmarNamibiaNepalNetherlandsNew CaledoniaNew ZealandNicaraguaNigerNigeriaNorth AmericaNorwayOECD membersOmanOther small statesPacific island small statesPakistanPalauPanamaPapua New GuineaParaguayPeruPhilippinesPolandPortugalPost-demographic dividendPre-demographic dividendPuerto RicoQatarRomaniaRussian FederationRwandaSamoaSao Tome and PrincipeSaudi ArabiaSenegalSerbiaSeychellesSierra LeoneSingaporeSlovak RepublicSloveniaSmall statesSolomon IslandsSouth AfricaSouth AsiaSouth Asia (IDA & IBRD)SpainSri LankaSt. Kitts and NevisSt. LuciaSt. Vincent and the GrenadinesSub-Saharan Africa Sub-Saharan Africa (excluding high income)Sub-Saharan Africa (IDA & IBRD countries)SudanSurinameSwazilandSwedenSwitzerlandSyrian Arab RepublicTajikistanTanzaniaThailandTimor-LesteTogoTongaTrinidad and TobagoTunisiaTurkeyTurkmenistanTuvaluUgandaUkraineUnited Arab EmiratesUnited KingdomUnited StatesUpper middle incomeUruguayUzbekistanVanuatuVenezuela, RBVietnamWest Bank and GazaWorldYemen, Rep.ZambiaZimbabwe Timeline:
This timeline shows a graph from 1977 to 2016 of Austria. No data until 1976. Number of actual observations by date: 40.
Source name:
World Development Indicators
Source organization:
World Bank national accounts data, and OECD National Accounts data files.
Categories, topics:
Economy & Growth
Last updated:
apr 23, 2017
Indicators value changes by year
Minimum:
14.598 bln
jan 1, 1977
Maximum:
114.982 bln
jan 1, 2009
At the date of observation
Value
Absolute change
Change from previous value
jan 1, 1977
14.598 bln
+14.598 bln
0.0%
jan 1, 1978
17.311 bln
+2.713 bln
18.59%
jan 1, 1979
20.989 bln
+3.677 bln
21.24%
jan 1, 1980
24.326 bln
+3.337 bln
15.9%
jan 1, 1981
27.013 bln
+2.688 bln
11.05%
jan 1, 1982
23.106 bln
-3.907 bln
-14.46%
jan 1, 1983
22.629 bln
-477.367 mln
-2.07%
jan 1, 1984
22.559 bln
-69.768 mln
-0.31%
jan 1, 1985
20.462 bln
-2.097 bln
-9.3%
jan 1, 1986
21.115 bln
+652.604 mln
3.19%
jan 1, 1987
29.951 bln
+8.836 bln
41.85%
jan 1, 1988
36.923 bln
+6.972 bln
23.28%
jan 1, 1989
39.338 bln
+2.415 bln
6.54%
jan 1, 1990
38.956 bln
-381.676 mln
-0.97%
jan 1, 1991
49.181 bln
+10.225 bln
26.25%
jan 1, 1992
51.251 bln
+2.07 bln
4.21%
jan 1, 1993
56.573 bln
+5.323 bln
10.39%
jan 1, 1994
53.856 bln
-2.717 bln
-4.8%
jan 1, 1995
57.801 bln
+3.945 bln
7.32%
jan 1, 1996
69.506 bln
+11.706 bln
20.25%
jan 1, 1997
68.181 bln
-1.325 bln
-1.91%
jan 1, 1998
60.786 bln
-7.395 bln
-10.85%
jan 1, 1999
62.057 bln
+1.271 bln
2.09%
jan 1, 2000
61.578 bln
-479.216 mln
-0.77%
jan 1, 2001
55.444 bln
-6.134 bln
-9.96%
jan 1, 2002
55.392 bln
-52.158 mln
-0.09%
jan 1, 2003
58.167 bln
+2.775 bln
5.01%
jan 1, 2004
71.403 bln
+13.236 bln
22.76%
jan 1, 2005
81.77 bln
+10.366 bln
14.52%
jan 1, 2006
84.877 bln
+3.108 bln
3.8%
jan 1, 2007
90.916 bln
+6.039 bln
7.11%
jan 1, 2008
106.293 bln
+15.377 bln
16.91%
jan 1, 2009
114.982 bln
+8.689 bln
8.17%
jan 1, 2010
102.348 bln
-12.634 bln
-10.99%
jan 1, 2011
99.675 bln
-2.673 bln
-2.61%
jan 1, 2012
109.012 bln
+9.337 bln
9.37%
jan 1, 2013
104.284 bln
-4.728 bln
-4.34%
jan 1, 2014
108.998 bln
+4.714 bln
4.52%
jan 1, 2015
110.449 bln
+1.451 bln
1.33%
jan 1, 2016
95.126 bln
-15.323 bln
-13.87%
Ranking of countries by current statistics by years


Comments: