29
/
en
AIzaSyAYiBZKx7MnpbEhh9jyipgxe19OcubqV5w
April 1, 2024
222339
Peru
PER
true
2
1
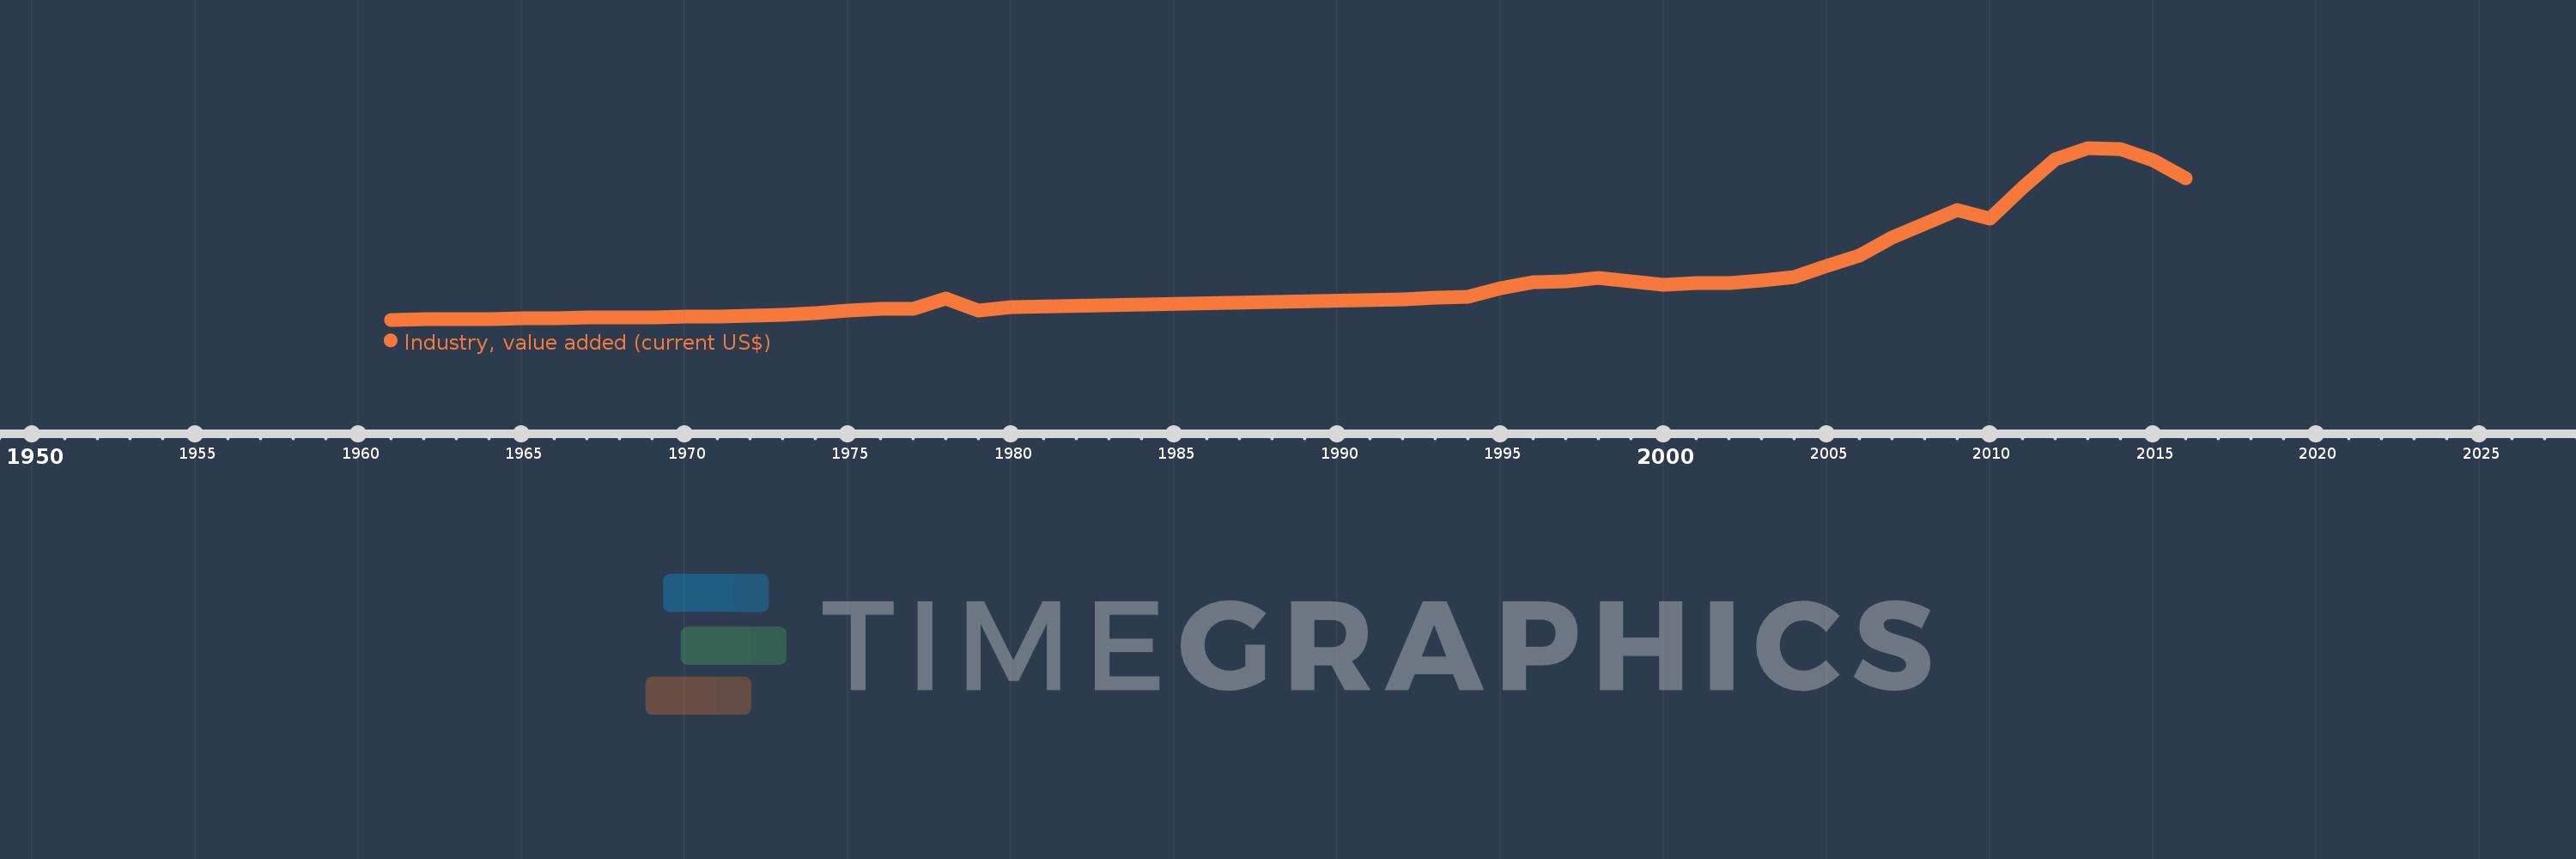
Industry, value added (current US$)
2016,2015,2014,2013,2012,2011,2010,2009,2008,2007,2006,2005,2004,2003,2002,2001,2000,1999,1998,1997,1996,1995,1994,1993,1992,1980,1979,1978,1977,1976,1975,1974,1973,1972,1971,1970,1969,1968,1967,1966,1965,1964,1963,1962,1961
This statistics in other country:
AfghanistanAlbaniaAlgeriaAndorraAngolaAntigua and BarbudaArab WorldArgentinaArmeniaArubaAustraliaAustriaAzerbaijanBahamas, TheBahrainBangladeshBarbadosBelarusBelgiumBelizeBeninBermudaBhutanBoliviaBosnia and HerzegovinaBotswanaBrazilBrunei DarussalamBulgariaBurkina FasoBurundiCabo VerdeCambodiaCameroonCanadaCaribbean small statesCayman IslandsCentral African RepublicCentral Europe and the BalticsChadChileChinaColombiaComorosCongo, Dem. Rep.Congo, Rep.Costa RicaCote d'IvoireCroatiaCubaCyprusCzech RepublicDenmarkDjiboutiDominicaDominican RepublicEarly-demographic dividendEast Asia & PacificEast Asia & Pacific (excluding high income)East Asia & Pacific (IDA & IBRD countries)EcuadorEgypt, Arab Rep.El SalvadorEquatorial GuineaEritreaEstoniaEthiopiaEuro areaEurope & Central AsiaEurope & Central Asia (excluding high income)Europe & Central Asia (IDA & IBRD countries)European UnionFijiFinlandFragile and conflict affected situationsFranceGabonGambia, TheGeorgiaGermanyGhanaGreeceGrenadaGuatemalaGuineaGuinea-BissauGuyanaHeavily indebted poor countries (HIPC)High incomeHondurasHong Kong SAR, ChinaHungaryIBRD onlyIcelandIDA & IBRD totalIDA blendIDA onlyIDA totalIndiaIndonesiaIran, Islamic Rep.IraqIrelandItalyJamaicaJapanJordanKazakhstanKenyaKiribatiKorea, Rep.KosovoKuwaitKyrgyz RepublicLao PDRLate-demographic dividendLatin America & Caribbean Latin America & Caribbean (excluding high income)Latin America & the Caribbean (IDA & IBRD countries)LatviaLeast developed countries: UN classificationLebanonLesothoLiberiaLibyaLiechtensteinLithuaniaLow & middle incomeLow incomeLower middle incomeLuxembourgMacao SAR, ChinaMacedonia, FYRMadagascarMalawiMalaysiaMaldivesMaliMaltaMarshall IslandsMauritaniaMauritiusMexicoMicronesia, Fed. Sts.Middle East & North AfricaMiddle East & North Africa (excluding high income)Middle East & North Africa (IDA & IBRD countries)Middle incomeMoldovaMongoliaMontenegroMoroccoMozambiqueMyanmarNamibiaNepalNetherlandsNew CaledoniaNew ZealandNicaraguaNigerNigeriaNorth AmericaNorwayOECD membersOmanOther small statesPacific island small statesPakistanPalauPanamaPapua New GuineaParaguayPeruPhilippinesPolandPortugalPost-demographic dividendPre-demographic dividendPuerto RicoQatarRomaniaRussian FederationRwandaSamoaSao Tome and PrincipeSaudi ArabiaSenegalSerbiaSeychellesSierra LeoneSingaporeSlovak RepublicSloveniaSmall statesSolomon IslandsSouth AfricaSouth AsiaSouth Asia (IDA & IBRD)SpainSri LankaSt. Kitts and NevisSt. LuciaSt. Vincent and the GrenadinesSub-Saharan Africa Sub-Saharan Africa (excluding high income)Sub-Saharan Africa (IDA & IBRD countries)SudanSurinameSwazilandSwedenSwitzerlandSyrian Arab RepublicTajikistanTanzaniaThailandTimor-LesteTogoTongaTrinidad and TobagoTunisiaTurkeyTurkmenistanTuvaluUgandaUkraineUnited Arab EmiratesUnited KingdomUnited StatesUpper middle incomeUruguayUzbekistanVanuatuVenezuela, RBVietnamWest Bank and GazaWorldYemen, Rep.ZambiaZimbabwe Timeline:
This timeline shows a graph from 1961 to 2016 of Peru. No data until 1960. Number of actual observations by date: 45.
Source name:
World Development Indicators
Source organization:
World Bank national accounts data, and OECD National Accounts data files.
Categories, topics:
Economy & Growth
Last updated:
apr 23, 2017
Indicators value changes by year
Minimum:
725.729 mln
jan 1, 1961
Maximum:
68.439 bln
jan 1, 2013
At the date of observation
Value
Absolute change
Change from previous value
jan 1, 1961
725.729 mln
+725.729 mln
0.0%
jan 1, 1962
802.582 mln
+76.853 mln
10.59%
jan 1, 1963
910.424 mln
+107.842 mln
13.44%
jan 1, 1964
936.673 mln
+26.249 mln
2.88%
jan 1, 1965
1.166 bln
+229.694 mln
24.52%
jan 1, 1966
1.363 bln
+196.293 mln
16.83%
jan 1, 1967
1.617 bln
+253.989 mln
18.64%
jan 1, 1968
1.721 bln
+104.504 mln
6.46%
jan 1, 1969
1.588 bln
-133.215 mln
-7.74%
jan 1, 1970
1.814 bln
+226.53 mln
14.27%
jan 1, 1971
2.1 bln
+285.399 mln
15.73%
jan 1, 1972
2.361 bln
+260.707 mln
12.42%
jan 1, 1973
2.642 bln
+281.247 mln
11.91%
jan 1, 1974
3.321 bln
+679.114 mln
25.71%
jan 1, 1975
4.41 bln
+1.089 bln
32.8%
jan 1, 1976
4.857 bln
+446.606 mln
10.13%
jan 1, 1977
4.977 bln
+120.828 mln
2.49%
jan 1, 1978
9.042 bln
+4.064 bln
81.65%
jan 1, 1979
4.252 bln
-4.79 bln
-52.97%
jan 1, 1980
5.72 bln
+1.468 bln
34.53%
jan 1, 1992
8.884 bln
+3.164 bln
55.31%
jan 1, 1993
9.452 bln
+567.743 mln
6.39%
jan 1, 1994
9.652 bln
+200.422 mln
2.12%
jan 1, 1995
13.084 bln
+3.432 bln
35.55%
jan 1, 1996
15.513 bln
+2.429 bln
18.57%
jan 1, 1997
15.951 bln
+438.288 mln
2.83%
jan 1, 1998
17.067 bln
+1.116 bln
7.0%
jan 1, 1999
15.804 bln
-1.263 bln
-7.4%
jan 1, 2000
14.354 bln
-1.45 bln
-9.17%
jan 1, 2001
15.024 bln
+669.378 mln
4.66%
jan 1, 2002
15.107 bln
+83.398 mln
0.56%
jan 1, 2003
16.129 bln
+1.022 bln
6.76%
jan 1, 2004
17.554 bln
+1.426 bln
8.84%
jan 1, 2005
21.8 bln
+4.246 bln
24.19%
jan 1, 2006
26.132 bln
+4.332 bln
19.87%
jan 1, 2007
33.204 bln
+7.072 bln
27.06%
jan 1, 2008
38.517 bln
+5.314 bln
16.0%
jan 1, 2009
43.792 bln
+5.275 bln
13.69%
jan 1, 2010
40.538 bln
-3.254 bln
-7.43%
jan 1, 2011
52.761 bln
+12.223 bln
30.15%
jan 1, 2012
63.943 bln
+11.182 bln
21.19%
jan 1, 2013
68.439 bln
+4.496 bln
7.03%
jan 1, 2014
68.095 bln
-344.898 mln
-0.5%
jan 1, 2015
63.632 bln
-4.462 bln
-6.55%
jan 1, 2016
56.5 bln
-7.132 bln
-11.21%
Ranking of countries by current statistics by years


Comments: