29
/
en
AIzaSyAYiBZKx7MnpbEhh9jyipgxe19OcubqV5w
April 1, 2024
250911
St. Lucia
LCA
true
2
1
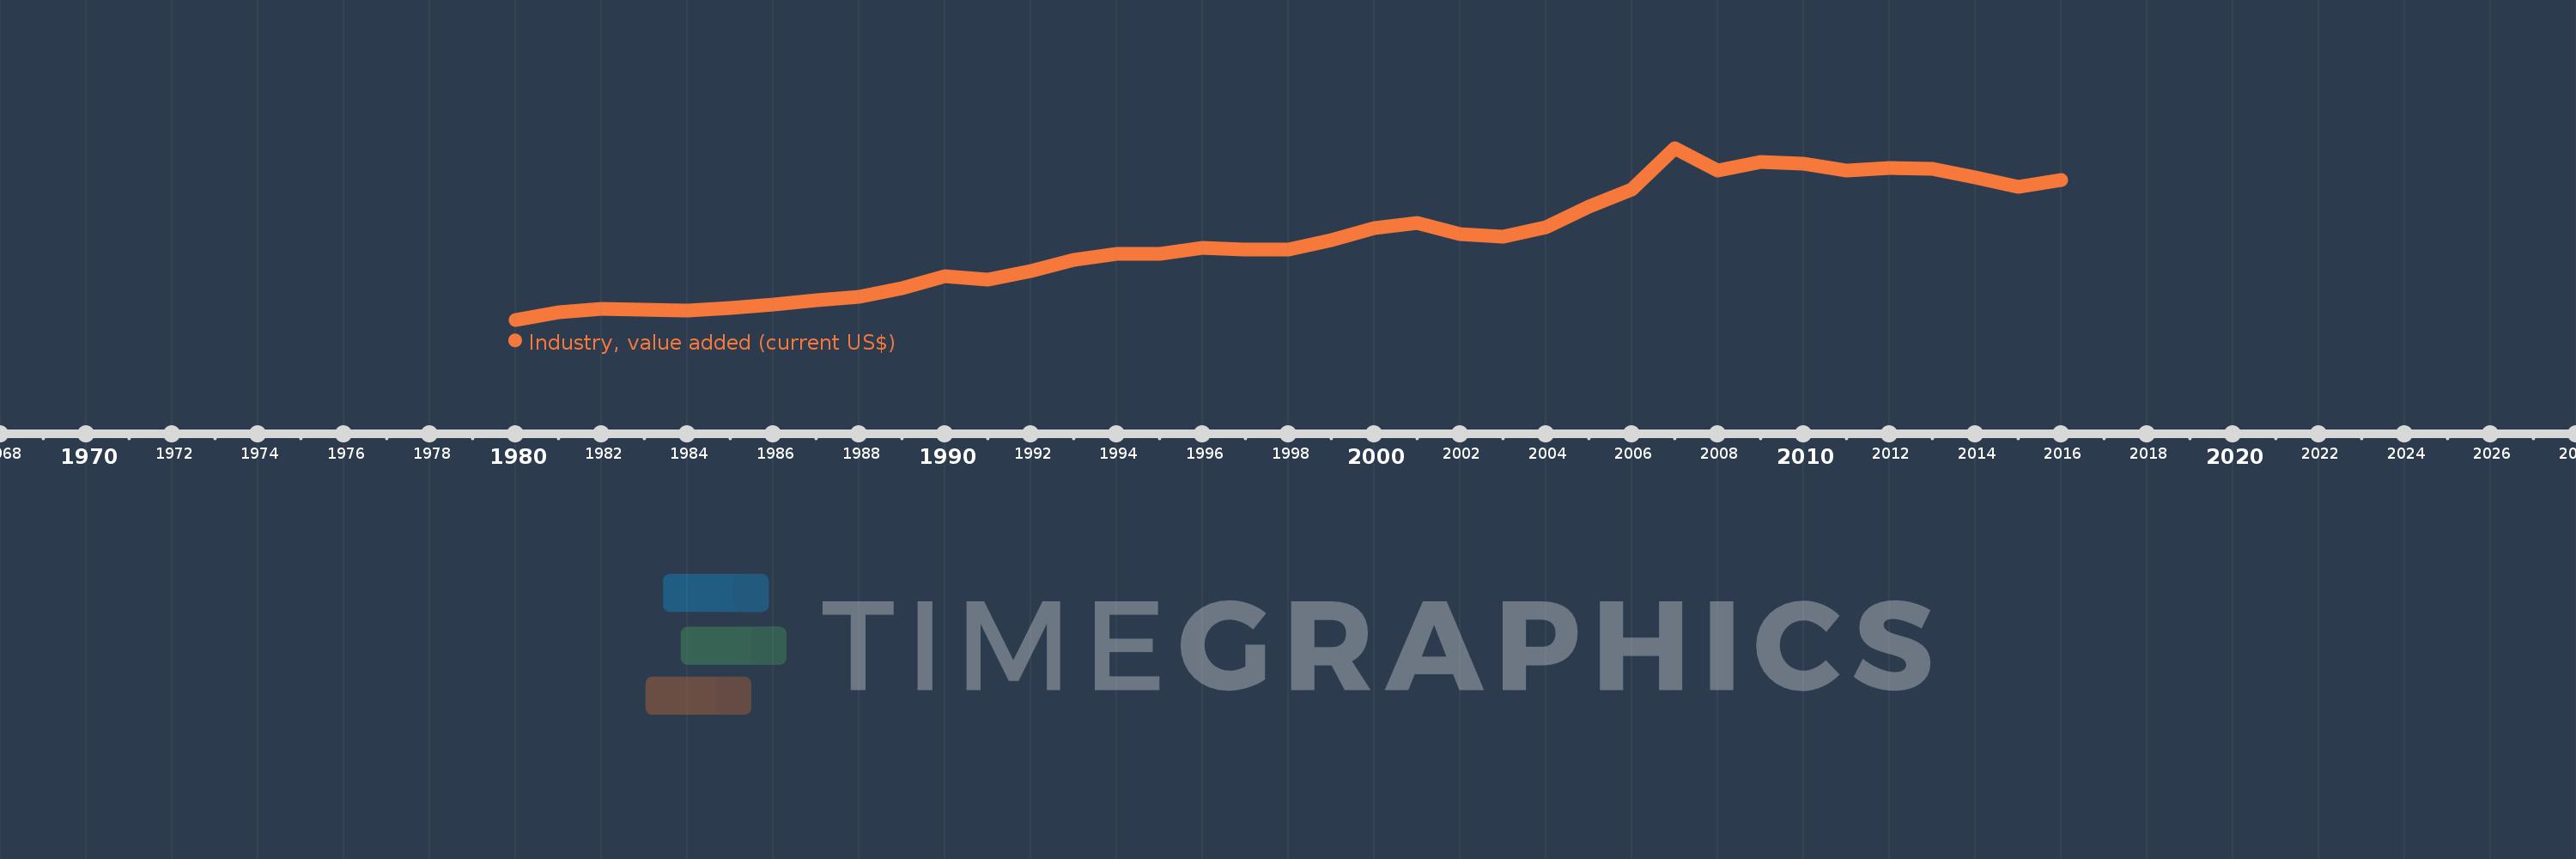
Industry, value added (current US$)
2016,2015,2014,2013,2012,2011,2010,2009,2008,2007,2006,2005,2004,2003,2002,2001,2000,1999,1998,1997,1996,1995,1994,1993,1992,1991,1990,1989,1988,1987,1986,1985,1984,1983,1982,1981,1980
This statistics in other country:
AfghanistanAlbaniaAlgeriaAndorraAngolaAntigua and BarbudaArab WorldArgentinaArmeniaArubaAustraliaAustriaAzerbaijanBahamas, TheBahrainBangladeshBarbadosBelarusBelgiumBelizeBeninBermudaBhutanBoliviaBosnia and HerzegovinaBotswanaBrazilBrunei DarussalamBulgariaBurkina FasoBurundiCabo VerdeCambodiaCameroonCanadaCaribbean small statesCayman IslandsCentral African RepublicCentral Europe and the BalticsChadChileChinaColombiaComorosCongo, Dem. Rep.Congo, Rep.Costa RicaCote d'IvoireCroatiaCubaCyprusCzech RepublicDenmarkDjiboutiDominicaDominican RepublicEarly-demographic dividendEast Asia & PacificEast Asia & Pacific (excluding high income)East Asia & Pacific (IDA & IBRD countries)EcuadorEgypt, Arab Rep.El SalvadorEquatorial GuineaEritreaEstoniaEthiopiaEuro areaEurope & Central AsiaEurope & Central Asia (excluding high income)Europe & Central Asia (IDA & IBRD countries)European UnionFijiFinlandFragile and conflict affected situationsFranceGabonGambia, TheGeorgiaGermanyGhanaGreeceGrenadaGuatemalaGuineaGuinea-BissauGuyanaHeavily indebted poor countries (HIPC)High incomeHondurasHong Kong SAR, ChinaHungaryIBRD onlyIcelandIDA & IBRD totalIDA blendIDA onlyIDA totalIndiaIndonesiaIran, Islamic Rep.IraqIrelandItalyJamaicaJapanJordanKazakhstanKenyaKiribatiKorea, Rep.KosovoKuwaitKyrgyz RepublicLao PDRLate-demographic dividendLatin America & Caribbean Latin America & Caribbean (excluding high income)Latin America & the Caribbean (IDA & IBRD countries)LatviaLeast developed countries: UN classificationLebanonLesothoLiberiaLibyaLiechtensteinLithuaniaLow & middle incomeLow incomeLower middle incomeLuxembourgMacao SAR, ChinaMacedonia, FYRMadagascarMalawiMalaysiaMaldivesMaliMaltaMarshall IslandsMauritaniaMauritiusMexicoMicronesia, Fed. Sts.Middle East & North AfricaMiddle East & North Africa (excluding high income)Middle East & North Africa (IDA & IBRD countries)Middle incomeMoldovaMongoliaMontenegroMoroccoMozambiqueMyanmarNamibiaNepalNetherlandsNew CaledoniaNew ZealandNicaraguaNigerNigeriaNorth AmericaNorwayOECD membersOmanOther small statesPacific island small statesPakistanPalauPanamaPapua New GuineaParaguayPeruPhilippinesPolandPortugalPost-demographic dividendPre-demographic dividendPuerto RicoQatarRomaniaRussian FederationRwandaSamoaSao Tome and PrincipeSaudi ArabiaSenegalSerbiaSeychellesSierra LeoneSingaporeSlovak RepublicSloveniaSmall statesSolomon IslandsSouth AfricaSouth AsiaSouth Asia (IDA & IBRD)SpainSri LankaSt. Kitts and NevisSt. LuciaSt. Vincent and the GrenadinesSub-Saharan Africa Sub-Saharan Africa (excluding high income)Sub-Saharan Africa (IDA & IBRD countries)SudanSurinameSwazilandSwedenSwitzerlandSyrian Arab RepublicTajikistanTanzaniaThailandTimor-LesteTogoTongaTrinidad and TobagoTunisiaTurkeyTurkmenistanTuvaluUgandaUkraineUnited Arab EmiratesUnited KingdomUnited StatesUpper middle incomeUruguayUzbekistanVanuatuVenezuela, RBVietnamWest Bank and GazaWorldYemen, Rep.ZambiaZimbabwe Timeline:
This timeline shows a graph from 1980 to 2016 of St. Lucia. No data until 1979. Number of actual observations by date: 37.
Source name:
World Development Indicators
Source organization:
World Bank national accounts data, and OECD National Accounts data files.
Categories, topics:
Economy & Growth
Last updated:
apr 23, 2017
Indicators value changes by year
Minimum:
19.333 mln
jan 1, 1980
Maximum:
193.993 mln
jan 1, 2007
At the date of observation
Value
Absolute change
Change from previous value
jan 1, 1980
19.333 mln
+19.333 mln
0.0%
jan 1, 1981
27.185 mln
+7.852 mln
40.61%
jan 1, 1982
30.393 mln
+3.207 mln
11.8%
jan 1, 1983
29.856 mln
-537.037K
-1.77%
jan 1, 1984
28.337 mln
-1.519 mln
-5.09%
jan 1, 1985
30.963 mln
+2.626 mln
9.27%
jan 1, 1986
34.393 mln
+3.43 mln
11.08%
jan 1, 1987
38.833 mln
+4.441 mln
12.91%
jan 1, 1988
42.548 mln
+3.715 mln
9.57%
jan 1, 1989
51.57 mln
+9.022 mln
21.2%
jan 1, 1990
63.859 mln
+12.289 mln
23.83%
jan 1, 1991
60.348 mln
-3.511 mln
-5.5%
jan 1, 1992
68.6 mln
+8.252 mln
13.67%
jan 1, 1993
80.096 mln
+11.496 mln
16.76%
jan 1, 1994
86.437 mln
+6.341 mln
7.92%
jan 1, 1995
86.159 mln
-277.778K
-0.32%
jan 1, 1996
92.622 mln
+6.463 mln
7.5%
jan 1, 1997
90.259 mln
-2.363 mln
-2.55%
jan 1, 1998
91.037 mln
+777.778K
0.86%
jan 1, 1999
99.985 mln
+8.948 mln
9.83%
jan 1, 2000
112.259 mln
+12.274 mln
12.28%
jan 1, 2001
118.158 mln
+5.899 mln
5.25%
jan 1, 2002
106.396 mln
-11.762 mln
-9.95%
jan 1, 2003
103.415 mln
-2.982 mln
-2.8%
jan 1, 2004
112.959 mln
+9.544 mln
9.23%
jan 1, 2005
133.958 mln
+20.999 mln
18.59%
jan 1, 2006
151.776 mln
+17.818 mln
13.3%
jan 1, 2007
193.993 mln
+42.217 mln
27.82%
jan 1, 2008
170.883 mln
-23.11 mln
-11.91%
jan 1, 2009
180.079 mln
+9.196 mln
5.38%
jan 1, 2010
178.064 mln
-2.015 mln
-1.12%
jan 1, 2011
170.598 mln
-7.466 mln
-4.19%
jan 1, 2012
173.924 mln
+3.326 mln
1.95%
jan 1, 2013
173.097 mln
-827.111K
-0.48%
jan 1, 2014
164.463 mln
-8.633 mln
-4.99%
jan 1, 2015
154.033 mln
-10.431 mln
-6.34%
jan 1, 2016
161.591 mln
+7.559 mln
4.91%
Ranking of countries by current statistics by years


Comments: