29
/
en
AIzaSyAYiBZKx7MnpbEhh9jyipgxe19OcubqV5w
April 1, 2024
133286
Finland
FIN
true
2
1
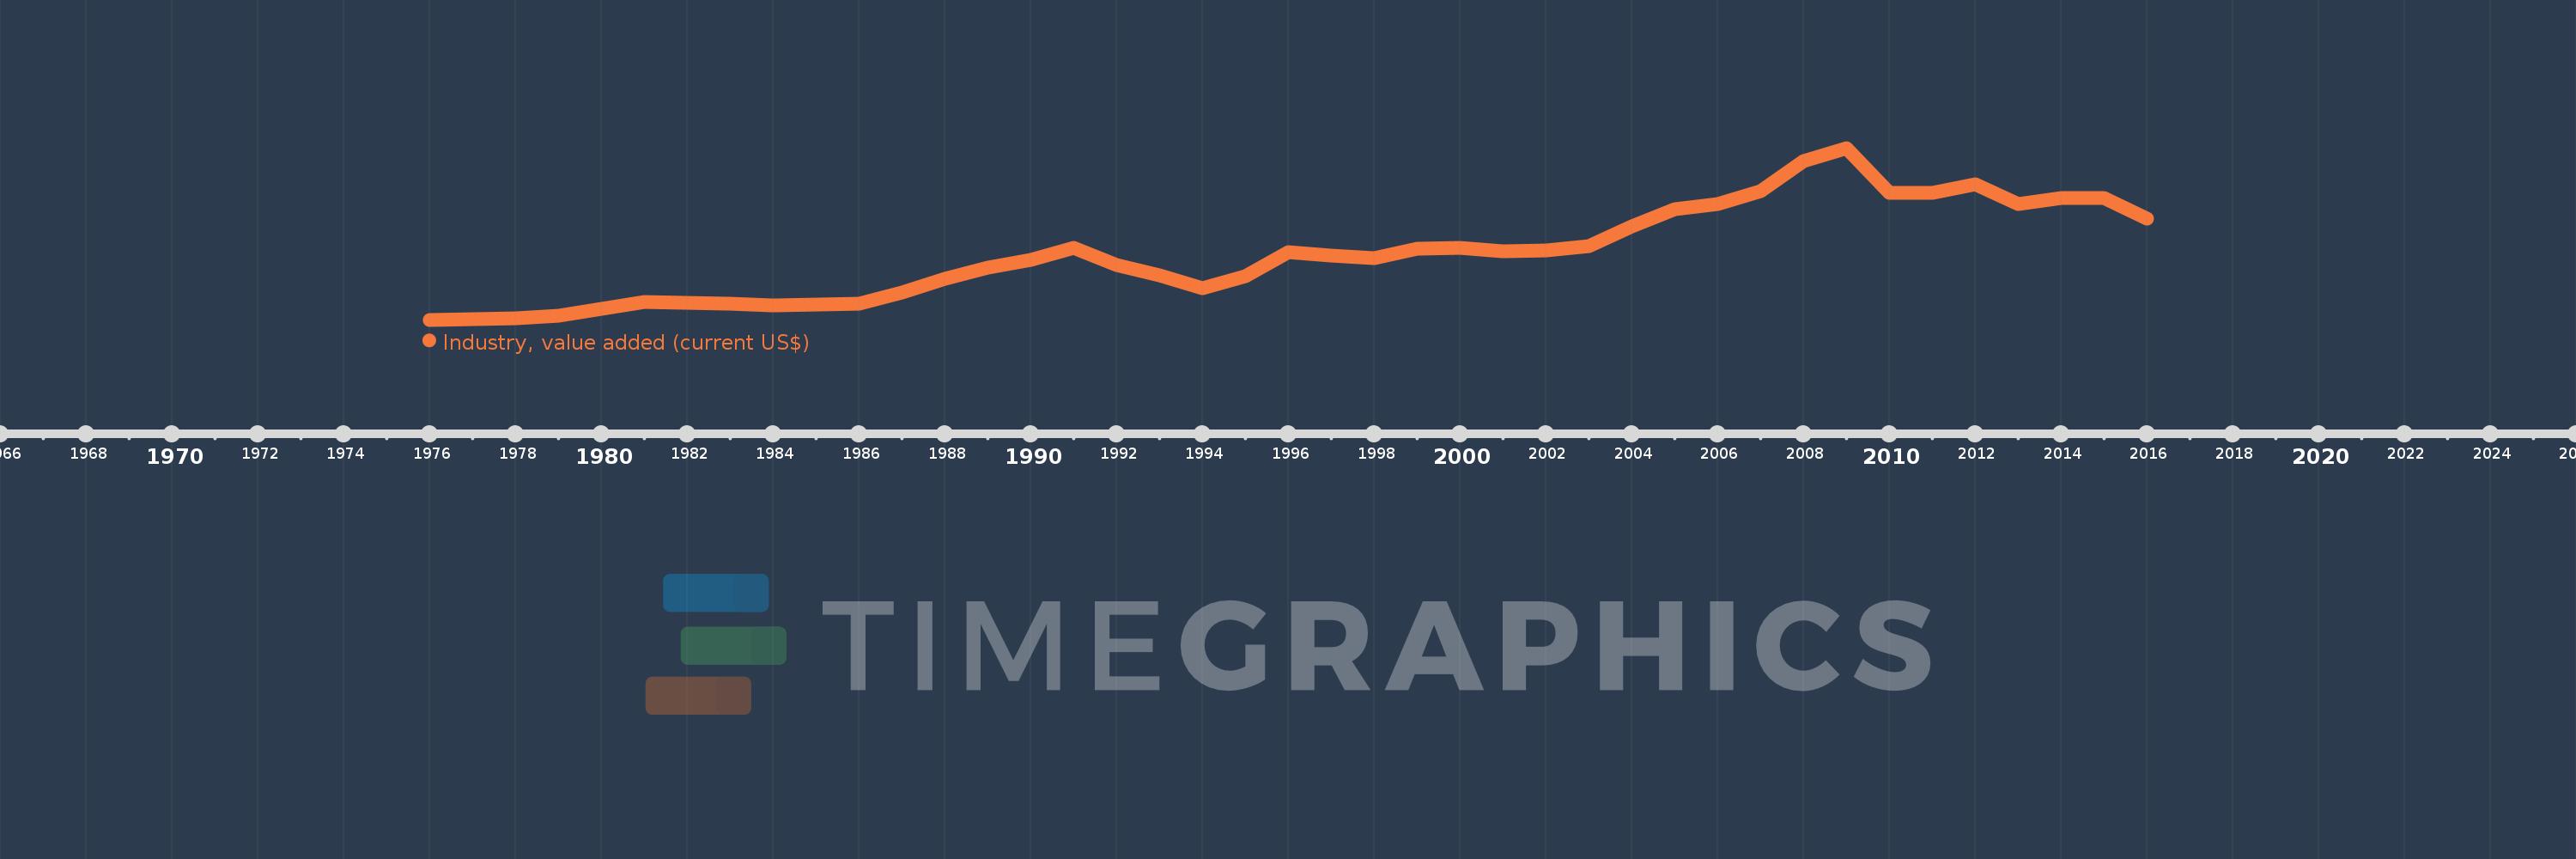
Industry, value added (current US$)
2016,2015,2014,2013,2012,2011,2010,2009,2008,2007,2006,2005,2004,2003,2002,2001,2000,1999,1998,1997,1996,1995,1994,1993,1992,1991,1990,1989,1988,1987,1986,1985,1984,1983,1982,1981,1980,1979,1978,1977,1976
This statistics in other country:
AfghanistanAlbaniaAlgeriaAndorraAngolaAntigua and BarbudaArab WorldArgentinaArmeniaArubaAustraliaAustriaAzerbaijanBahamas, TheBahrainBangladeshBarbadosBelarusBelgiumBelizeBeninBermudaBhutanBoliviaBosnia and HerzegovinaBotswanaBrazilBrunei DarussalamBulgariaBurkina FasoBurundiCabo VerdeCambodiaCameroonCanadaCaribbean small statesCayman IslandsCentral African RepublicCentral Europe and the BalticsChadChileChinaColombiaComorosCongo, Dem. Rep.Congo, Rep.Costa RicaCote d'IvoireCroatiaCubaCyprusCzech RepublicDenmarkDjiboutiDominicaDominican RepublicEarly-demographic dividendEast Asia & PacificEast Asia & Pacific (excluding high income)East Asia & Pacific (IDA & IBRD countries)EcuadorEgypt, Arab Rep.El SalvadorEquatorial GuineaEritreaEstoniaEthiopiaEuro areaEurope & Central AsiaEurope & Central Asia (excluding high income)Europe & Central Asia (IDA & IBRD countries)European UnionFijiFinlandFragile and conflict affected situationsFranceGabonGambia, TheGeorgiaGermanyGhanaGreeceGrenadaGuatemalaGuineaGuinea-BissauGuyanaHeavily indebted poor countries (HIPC)High incomeHondurasHong Kong SAR, ChinaHungaryIBRD onlyIcelandIDA & IBRD totalIDA blendIDA onlyIDA totalIndiaIndonesiaIran, Islamic Rep.IraqIrelandItalyJamaicaJapanJordanKazakhstanKenyaKiribatiKorea, Rep.KosovoKuwaitKyrgyz RepublicLao PDRLate-demographic dividendLatin America & Caribbean Latin America & Caribbean (excluding high income)Latin America & the Caribbean (IDA & IBRD countries)LatviaLeast developed countries: UN classificationLebanonLesothoLiberiaLibyaLiechtensteinLithuaniaLow & middle incomeLow incomeLower middle incomeLuxembourgMacao SAR, ChinaMacedonia, FYRMadagascarMalawiMalaysiaMaldivesMaliMaltaMarshall IslandsMauritaniaMauritiusMexicoMicronesia, Fed. Sts.Middle East & North AfricaMiddle East & North Africa (excluding high income)Middle East & North Africa (IDA & IBRD countries)Middle incomeMoldovaMongoliaMontenegroMoroccoMozambiqueMyanmarNamibiaNepalNetherlandsNew CaledoniaNew ZealandNicaraguaNigerNigeriaNorth AmericaNorwayOECD membersOmanOther small statesPacific island small statesPakistanPalauPanamaPapua New GuineaParaguayPeruPhilippinesPolandPortugalPost-demographic dividendPre-demographic dividendPuerto RicoQatarRomaniaRussian FederationRwandaSamoaSao Tome and PrincipeSaudi ArabiaSenegalSerbiaSeychellesSierra LeoneSingaporeSlovak RepublicSloveniaSmall statesSolomon IslandsSouth AfricaSouth AsiaSouth Asia (IDA & IBRD)SpainSri LankaSt. Kitts and NevisSt. LuciaSt. Vincent and the GrenadinesSub-Saharan Africa Sub-Saharan Africa (excluding high income)Sub-Saharan Africa (IDA & IBRD countries)SudanSurinameSwazilandSwedenSwitzerlandSyrian Arab RepublicTajikistanTanzaniaThailandTimor-LesteTogoTongaTrinidad and TobagoTunisiaTurkeyTurkmenistanTuvaluUgandaUkraineUnited Arab EmiratesUnited KingdomUnited StatesUpper middle incomeUruguayUzbekistanVanuatuVenezuela, RBVietnamWest Bank and GazaWorldYemen, Rep.ZambiaZimbabwe Timeline:
This timeline shows a graph from 1976 to 2016 of Finland. No data until 1975. Number of actual observations by date: 41.
Source name:
World Development Indicators
Source organization:
World Bank national accounts data, and OECD National Accounts data files.
Categories, topics:
Economy & Growth
Last updated:
apr 23, 2017
Indicators value changes by year
Minimum:
10.459 bln
jan 1, 1976
Maximum:
84.097 bln
jan 1, 2009
At the date of observation
Value
Absolute change
Change from previous value
jan 1, 1976
10.459 bln
+10.459 bln
0.0%
jan 1, 1977
10.847 bln
+387.725 mln
3.71%
jan 1, 1978
11.222 bln
+375.064 mln
3.46%
jan 1, 1979
12.193 bln
+971.333 mln
8.66%
jan 1, 1980
15.257 bln
+3.064 bln
25.13%
jan 1, 1981
18.263 bln
+3.006 bln
19.7%
jan 1, 1982
17.614 bln
-649.004 mln
-3.55%
jan 1, 1983
17.288 bln
-326.138 mln
-1.85%
jan 1, 1984
16.617 bln
-670.322 mln
-3.88%
jan 1, 1985
16.947 bln
+329.765 mln
1.98%
jan 1, 1986
17.278 bln
+331.423 mln
1.96%
jan 1, 1987
22.15 bln
+4.871 bln
28.19%
jan 1, 1988
27.913 bln
+5.763 bln
26.02%
jan 1, 1989
32.81 bln
+4.897 bln
17.55%
jan 1, 1990
36.173 bln
+3.363 bln
10.25%
jan 1, 1991
41.328 bln
+5.155 bln
14.25%
jan 1, 1992
33.874 bln
-7.454 bln
-18.04%
jan 1, 1993
29.546 bln
-4.328 bln
-12.78%
jan 1, 1994
24.049 bln
-5.497 bln
-18.6%
jan 1, 1995
29.15 bln
+5.101 bln
21.21%
jan 1, 1996
39.57 bln
+10.42 bln
35.75%
jan 1, 1997
38.104 bln
-1.466 bln
-3.7%
jan 1, 1998
36.837 bln
-1.267 bln
-3.33%
jan 1, 1999
40.919 bln
+4.082 bln
11.08%
jan 1, 2000
41.152 bln
+232.712 mln
0.57%
jan 1, 2001
39.708 bln
-1.444 bln
-3.51%
jan 1, 2002
40.047 bln
+339.486 mln
0.85%
jan 1, 2003
42.071 bln
+2.024 bln
5.05%
jan 1, 2004
50.571 bln
+8.5 bln
20.2%
jan 1, 2005
57.895 bln
+7.324 bln
14.48%
jan 1, 2006
59.905 bln
+2.01 bln
3.47%
jan 1, 2007
65.59 bln
+5.685 bln
9.49%
jan 1, 2008
78.519 bln
+12.929 bln
19.71%
jan 1, 2009
84.097 bln
+5.578 bln
7.1%
jan 1, 2010
64.764 bln
-19.333 bln
-22.99%
jan 1, 2011
64.958 bln
+193.793 mln
0.3%
jan 1, 2012
68.453 bln
+3.495 bln
5.38%
jan 1, 2013
59.903 bln
-8.55 bln
-12.49%
jan 1, 2014
62.78 bln
+2.877 bln
4.8%
jan 1, 2015
62.768 bln
-11.784 mln
-0.02%
jan 1, 2016
53.702 bln
-9.066 bln
-14.44%
Ranking of countries by current statistics by years


Comments: