29
/
en
AIzaSyAYiBZKx7MnpbEhh9jyipgxe19OcubqV5w
April 1, 2024
126333
El Salvador
SLV
true
2
1
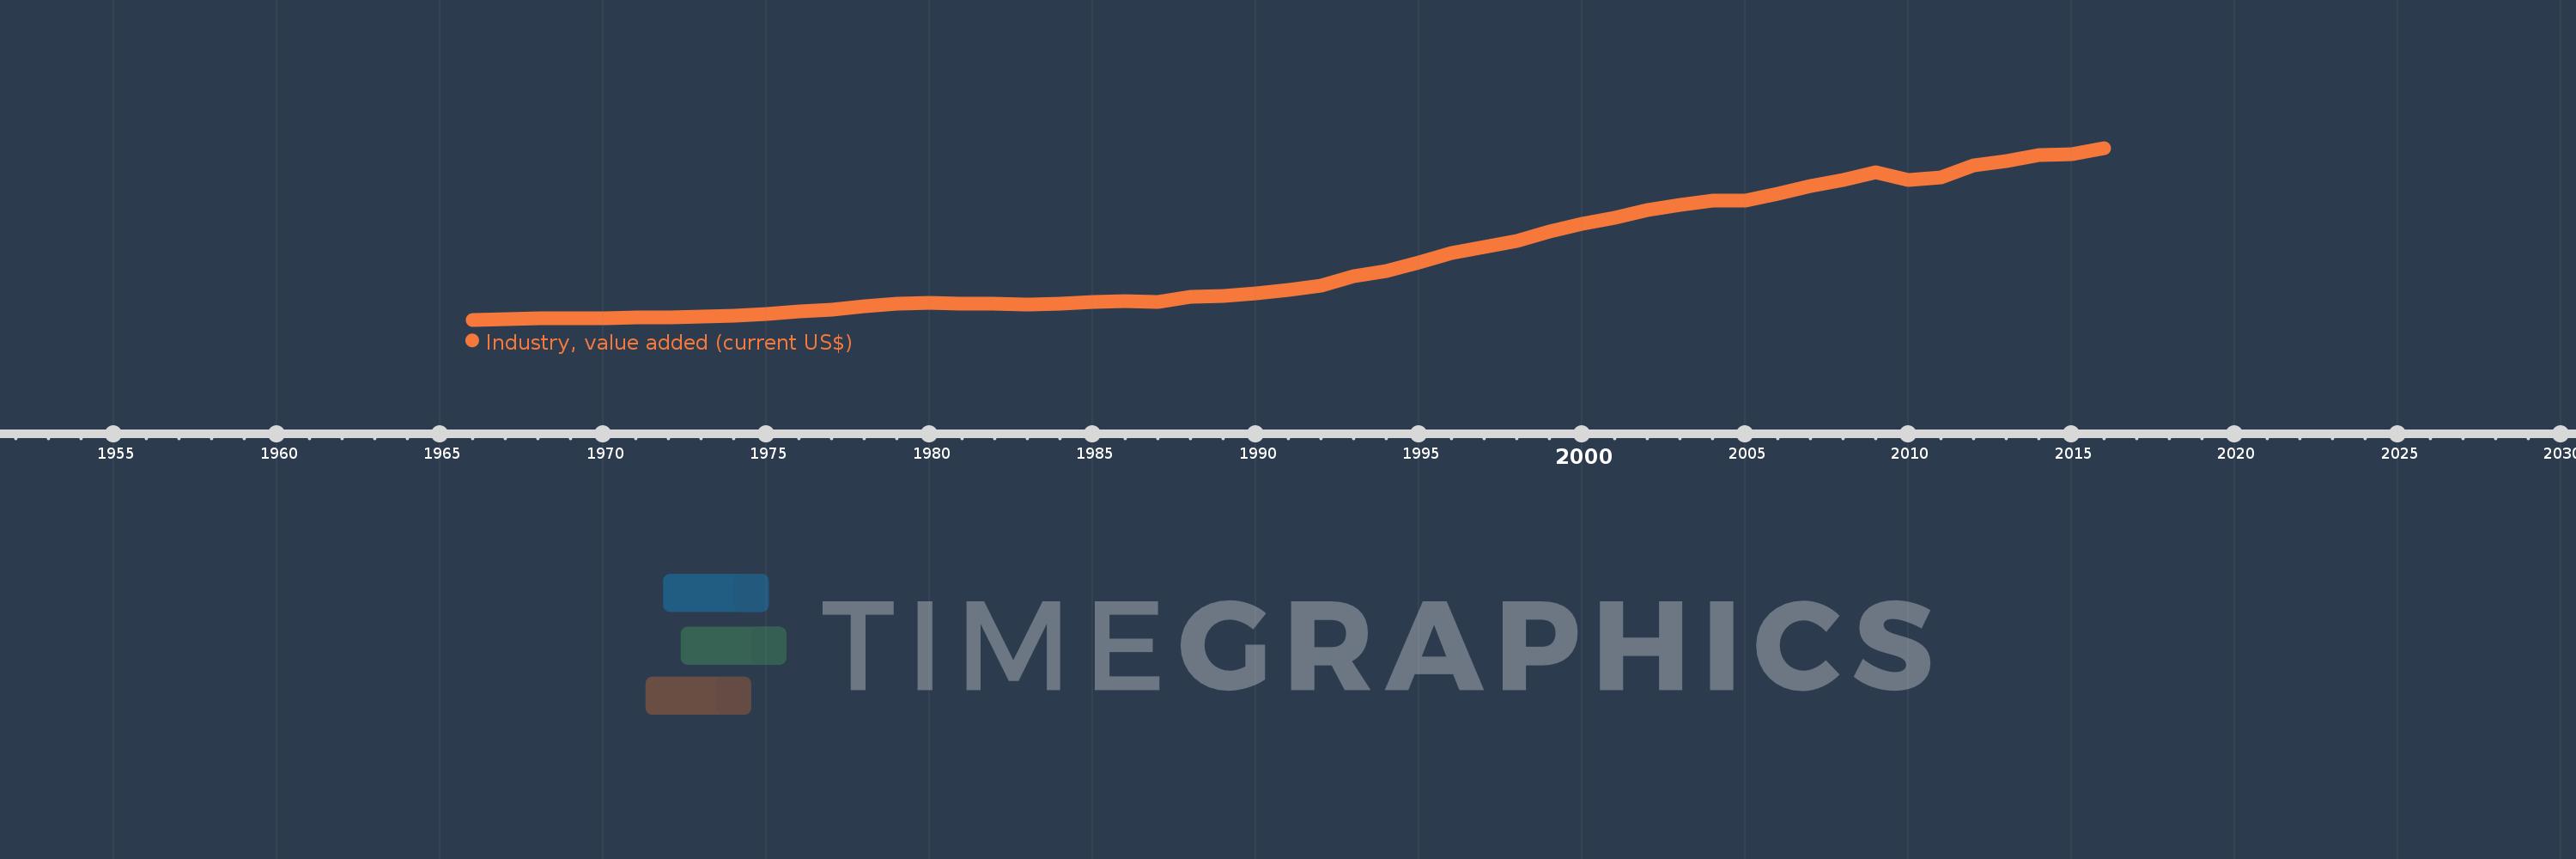
Industry, value added (current US$)
2016,2015,2014,2013,2012,2011,2010,2009,2008,2007,2006,2005,2004,2003,2002,2001,2000,1999,1998,1997,1996,1995,1994,1993,1992,1991,1990,1989,1988,1987,1986,1985,1984,1983,1982,1981,1980,1979,1978,1977,1976,1975,1974,1973,1972,1971,1970,1969,1968,1967,1966
This statistics in other country:
AfghanistanAlbaniaAlgeriaAndorraAngolaAntigua and BarbudaArab WorldArgentinaArmeniaArubaAustraliaAustriaAzerbaijanBahamas, TheBahrainBangladeshBarbadosBelarusBelgiumBelizeBeninBermudaBhutanBoliviaBosnia and HerzegovinaBotswanaBrazilBrunei DarussalamBulgariaBurkina FasoBurundiCabo VerdeCambodiaCameroonCanadaCaribbean small statesCayman IslandsCentral African RepublicCentral Europe and the BalticsChadChileChinaColombiaComorosCongo, Dem. Rep.Congo, Rep.Costa RicaCote d'IvoireCroatiaCubaCyprusCzech RepublicDenmarkDjiboutiDominicaDominican RepublicEarly-demographic dividendEast Asia & PacificEast Asia & Pacific (excluding high income)East Asia & Pacific (IDA & IBRD countries)EcuadorEgypt, Arab Rep.El SalvadorEquatorial GuineaEritreaEstoniaEthiopiaEuro areaEurope & Central AsiaEurope & Central Asia (excluding high income)Europe & Central Asia (IDA & IBRD countries)European UnionFijiFinlandFragile and conflict affected situationsFranceGabonGambia, TheGeorgiaGermanyGhanaGreeceGrenadaGuatemalaGuineaGuinea-BissauGuyanaHeavily indebted poor countries (HIPC)High incomeHondurasHong Kong SAR, ChinaHungaryIBRD onlyIcelandIDA & IBRD totalIDA blendIDA onlyIDA totalIndiaIndonesiaIran, Islamic Rep.IraqIrelandItalyJamaicaJapanJordanKazakhstanKenyaKiribatiKorea, Rep.KosovoKuwaitKyrgyz RepublicLao PDRLate-demographic dividendLatin America & Caribbean Latin America & Caribbean (excluding high income)Latin America & the Caribbean (IDA & IBRD countries)LatviaLeast developed countries: UN classificationLebanonLesothoLiberiaLibyaLiechtensteinLithuaniaLow & middle incomeLow incomeLower middle incomeLuxembourgMacao SAR, ChinaMacedonia, FYRMadagascarMalawiMalaysiaMaldivesMaliMaltaMarshall IslandsMauritaniaMauritiusMexicoMicronesia, Fed. Sts.Middle East & North AfricaMiddle East & North Africa (excluding high income)Middle East & North Africa (IDA & IBRD countries)Middle incomeMoldovaMongoliaMontenegroMoroccoMozambiqueMyanmarNamibiaNepalNetherlandsNew CaledoniaNew ZealandNicaraguaNigerNigeriaNorth AmericaNorwayOECD membersOmanOther small statesPacific island small statesPakistanPalauPanamaPapua New GuineaParaguayPeruPhilippinesPolandPortugalPost-demographic dividendPre-demographic dividendPuerto RicoQatarRomaniaRussian FederationRwandaSamoaSao Tome and PrincipeSaudi ArabiaSenegalSerbiaSeychellesSierra LeoneSingaporeSlovak RepublicSloveniaSmall statesSolomon IslandsSouth AfricaSouth AsiaSouth Asia (IDA & IBRD)SpainSri LankaSt. Kitts and NevisSt. LuciaSt. Vincent and the GrenadinesSub-Saharan Africa Sub-Saharan Africa (excluding high income)Sub-Saharan Africa (IDA & IBRD countries)SudanSurinameSwazilandSwedenSwitzerlandSyrian Arab RepublicTajikistanTanzaniaThailandTimor-LesteTogoTongaTrinidad and TobagoTunisiaTurkeyTurkmenistanTuvaluUgandaUkraineUnited Arab EmiratesUnited KingdomUnited StatesUpper middle incomeUruguayUzbekistanVanuatuVenezuela, RBVietnamWest Bank and GazaWorldYemen, Rep.ZambiaZimbabwe Timeline:
This timeline shows a graph from 1966 to 2016 of El Salvador. No data until 1965. Number of actual observations by date: 51.
Source name:
World Development Indicators
Source organization:
World Bank national accounts data, and OECD National Accounts data files.
Categories, topics:
Economy & Growth
Last updated:
apr 23, 2017
Indicators value changes by year
Minimum:
203.12 mln
jan 1, 1966
Maximum:
6.372 bln
jan 1, 2016
At the date of observation
Value
Absolute change
Change from previous value
jan 1, 1966
203.12 mln
+203.12 mln
0.0%
jan 1, 1967
230.92 mln
+27.8 mln
13.69%
jan 1, 1968
240.64 mln
+9.72 mln
4.21%
jan 1, 1969
248.68 mln
+8.04 mln
3.34%
jan 1, 1970
262.56 mln
+13.88 mln
5.58%
jan 1, 1971
274.88 mln
+12.32 mln
4.69%
jan 1, 1972
294.24 mln
+19.36 mln
7.04%
jan 1, 1973
323.28 mln
+29.04 mln
9.87%
jan 1, 1974
350.16 mln
+26.88 mln
8.31%
jan 1, 1975
418.68 mln
+68.52 mln
19.57%
jan 1, 1976
499.6 mln
+80.92 mln
19.33%
jan 1, 1977
558.72 mln
+59.12 mln
11.83%
jan 1, 1978
673.76 mln
+115.04 mln
20.59%
jan 1, 1979
782.76 mln
+109.0 mln
16.18%
jan 1, 1980
819.28 mln
+36.52 mln
4.67%
jan 1, 1981
784.32 mln
-34.96 mln
-4.27%
jan 1, 1982
772.64 mln
-11.68 mln
-1.49%
jan 1, 1983
753.243 mln
-19.397 mln
-2.51%
jan 1, 1984
783.617 mln
+30.374 mln
4.03%
jan 1, 1985
826.172 mln
+42.555 mln
5.43%
jan 1, 1986
887.649 mln
+61.477 mln
7.44%
jan 1, 1987
855.895 mln
-31.754 mln
-3.58%
jan 1, 1988
1.013 bln
+156.787 mln
18.32%
jan 1, 1989
1.063 bln
+50.691 mln
5.01%
jan 1, 1990
1.159 bln
+95.934 mln
9.02%
jan 1, 1991
1.283 bln
+124.092 mln
10.7%
jan 1, 1992
1.416 bln
+132.9 mln
10.36%
jan 1, 1993
1.761 bln
+344.5 mln
24.32%
jan 1, 1994
1.956 bln
+195.6 mln
11.11%
jan 1, 1995
2.263 bln
+306.6 mln
15.67%
jan 1, 1996
2.603 bln
+339.6 mln
15.01%
jan 1, 1997
2.825 bln
+222.5 mln
8.55%
jan 1, 1998
3.037 bln
+212.0 mln
7.5%
jan 1, 1999
3.386 bln
+348.8 mln
11.48%
jan 1, 2000
3.651 bln
+264.7 mln
7.82%
jan 1, 2001
3.878 bln
+227.1 mln
6.22%
jan 1, 2002
4.132 bln
+254.4 mln
6.56%
jan 1, 2003
4.316 bln
+183.9 mln
4.45%
jan 1, 2004
4.468 bln
+151.9 mln
3.52%
jan 1, 2005
4.49 bln
+22.4 mln
0.5%
jan 1, 2006
4.717 bln
+227.1 mln
5.06%
jan 1, 2007
4.997 bln
+280.0 mln
5.94%
jan 1, 2008
5.232 bln
+234.9 mln
4.7%
jan 1, 2009
5.494 bln
+261.7 mln
5.0%
jan 1, 2010
5.206 bln
-287.9 mln
-5.24%
jan 1, 2011
5.31 bln
+104.3 mln
2.0%
jan 1, 2012
5.735 bln
+424.6 mln
8.0%
jan 1, 2013
5.91 bln
+175.1 mln
3.05%
jan 1, 2014
6.101 bln
+191.2 mln
3.24%
jan 1, 2015
6.156 bln
+55.0 mln
0.9%
jan 1, 2016
6.372 bln
+215.5 mln
3.5%
Ranking of countries by current statistics by years


Comments: