29
/
en
AIzaSyAYiBZKx7MnpbEhh9jyipgxe19OcubqV5w
April 1, 2024
43531
Latin America & the Caribbean (IDA & IBRD countries)
TLA
false
2
1
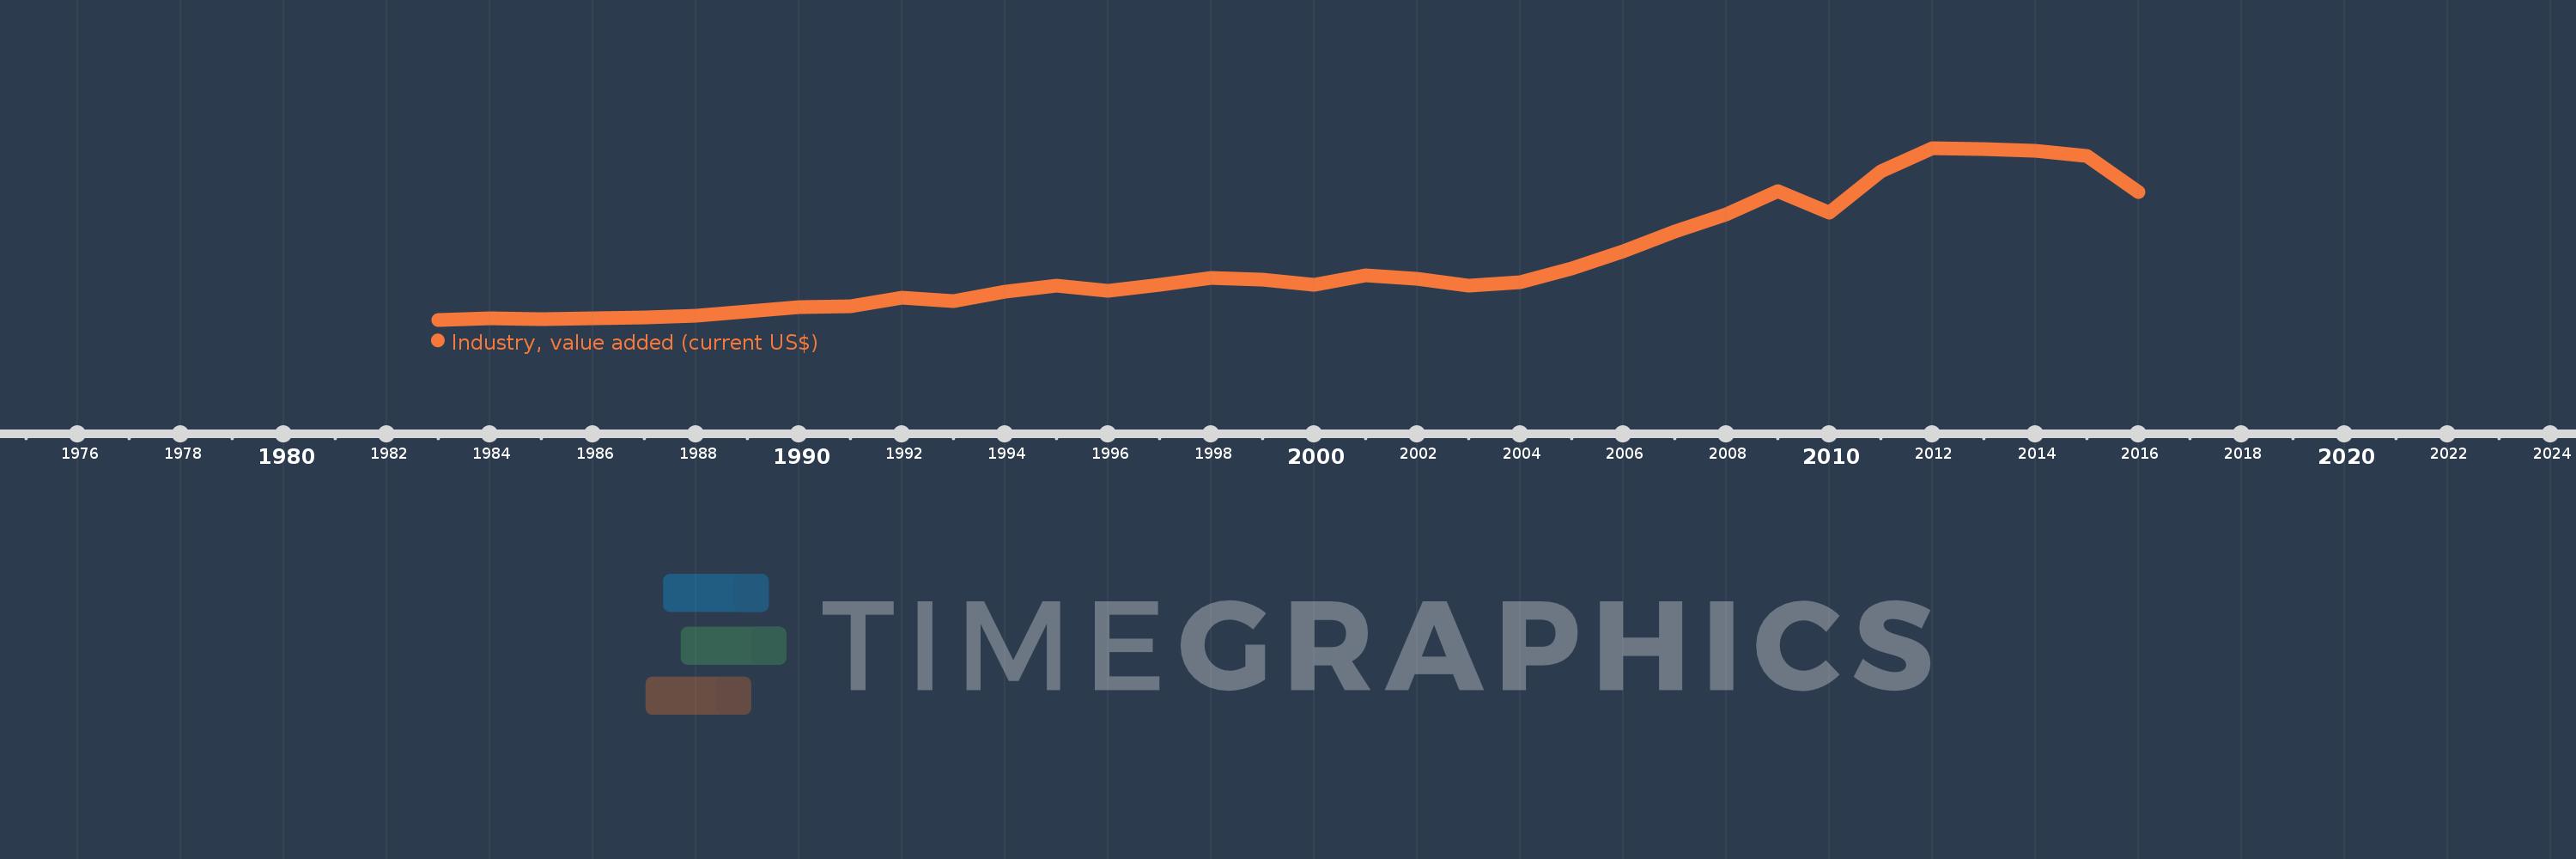
Industry, value added (current US$)
2016,2015,2014,2013,2012,2011,2010,2009,2008,2007,2006,2005,2004,2003,2002,2001,2000,1999,1998,1997,1996,1995,1994,1993,1992,1991,1990,1989,1988,1987,1986,1985,1984,1983
This statistics in other country:
AfghanistanAlbaniaAlgeriaAndorraAngolaAntigua and BarbudaArab WorldArgentinaArmeniaArubaAustraliaAustriaAzerbaijanBahamas, TheBahrainBangladeshBarbadosBelarusBelgiumBelizeBeninBermudaBhutanBoliviaBosnia and HerzegovinaBotswanaBrazilBrunei DarussalamBulgariaBurkina FasoBurundiCabo VerdeCambodiaCameroonCanadaCaribbean small statesCayman IslandsCentral African RepublicCentral Europe and the BalticsChadChileChinaColombiaComorosCongo, Dem. Rep.Congo, Rep.Costa RicaCote d'IvoireCroatiaCubaCyprusCzech RepublicDenmarkDjiboutiDominicaDominican RepublicEarly-demographic dividendEast Asia & PacificEast Asia & Pacific (excluding high income)East Asia & Pacific (IDA & IBRD countries)EcuadorEgypt, Arab Rep.El SalvadorEquatorial GuineaEritreaEstoniaEthiopiaEuro areaEurope & Central AsiaEurope & Central Asia (excluding high income)Europe & Central Asia (IDA & IBRD countries)European UnionFijiFinlandFragile and conflict affected situationsFranceGabonGambia, TheGeorgiaGermanyGhanaGreeceGrenadaGuatemalaGuineaGuinea-BissauGuyanaHeavily indebted poor countries (HIPC)High incomeHondurasHong Kong SAR, ChinaHungaryIBRD onlyIcelandIDA & IBRD totalIDA blendIDA onlyIDA totalIndiaIndonesiaIran, Islamic Rep.IraqIrelandItalyJamaicaJapanJordanKazakhstanKenyaKiribatiKorea, Rep.KosovoKuwaitKyrgyz RepublicLao PDRLate-demographic dividendLatin America & Caribbean Latin America & Caribbean (excluding high income)Latin America & the Caribbean (IDA & IBRD countries)LatviaLeast developed countries: UN classificationLebanonLesothoLiberiaLibyaLiechtensteinLithuaniaLow & middle incomeLow incomeLower middle incomeLuxembourgMacao SAR, ChinaMacedonia, FYRMadagascarMalawiMalaysiaMaldivesMaliMaltaMarshall IslandsMauritaniaMauritiusMexicoMicronesia, Fed. Sts.Middle East & North AfricaMiddle East & North Africa (excluding high income)Middle East & North Africa (IDA & IBRD countries)Middle incomeMoldovaMongoliaMontenegroMoroccoMozambiqueMyanmarNamibiaNepalNetherlandsNew CaledoniaNew ZealandNicaraguaNigerNigeriaNorth AmericaNorwayOECD membersOmanOther small statesPacific island small statesPakistanPalauPanamaPapua New GuineaParaguayPeruPhilippinesPolandPortugalPost-demographic dividendPre-demographic dividendPuerto RicoQatarRomaniaRussian FederationRwandaSamoaSao Tome and PrincipeSaudi ArabiaSenegalSerbiaSeychellesSierra LeoneSingaporeSlovak RepublicSloveniaSmall statesSolomon IslandsSouth AfricaSouth AsiaSouth Asia (IDA & IBRD)SpainSri LankaSt. Kitts and NevisSt. LuciaSt. Vincent and the GrenadinesSub-Saharan Africa Sub-Saharan Africa (excluding high income)Sub-Saharan Africa (IDA & IBRD countries)SudanSurinameSwazilandSwedenSwitzerlandSyrian Arab RepublicTajikistanTanzaniaThailandTimor-LesteTogoTongaTrinidad and TobagoTunisiaTurkeyTurkmenistanTuvaluUgandaUkraineUnited Arab EmiratesUnited KingdomUnited StatesUpper middle incomeUruguayUzbekistanVanuatuVenezuela, RBVietnamWest Bank and GazaWorldYemen, Rep.ZambiaZimbabwe Timeline:
This timeline shows a graph from 1983 to 2016 of Latin America & the Caribbean (IDA & IBRD countries). No data until 1982. Number of actual observations by date: 34.
Source name:
World Development Indicators
Source organization:
World Bank national accounts data, and OECD National Accounts data files.
Categories, topics:
Economy & Growth
Last updated:
apr 23, 2017
Indicators value changes by year
Minimum:
242.766 bln
jan 1, 1983
Maximum:
1.704 trl
jan 1, 2012
At the date of observation
Value
Absolute change
Change from previous value
jan 1, 1983
242.766 bln
+242.766 bln
0.0%
jan 1, 1984
253.116 bln
+10.35 bln
4.26%
jan 1, 1985
249.406 bln
-3.71 bln
-1.47%
jan 1, 1986
257.909 bln
+8.503 bln
3.41%
jan 1, 1987
263.899 bln
+5.99 bln
2.32%
jan 1, 1988
280.209 bln
+16.31 bln
6.18%
jan 1, 1989
315.038 bln
+34.829 bln
12.43%
jan 1, 1990
352.533 bln
+37.495 bln
11.9%
jan 1, 1991
358.343 bln
+5.81 bln
1.65%
jan 1, 1992
427.371 bln
+69.028 bln
19.26%
jan 1, 1993
403.6 bln
-23.772 bln
-5.56%
jan 1, 1994
482.744 bln
+79.145 bln
19.61%
jan 1, 1995
531.69 bln
+48.945 bln
10.14%
jan 1, 1996
491.657 bln
-40.033 bln
-7.53%
jan 1, 1997
539.773 bln
+48.116 bln
9.79%
jan 1, 1998
597.845 bln
+58.072 bln
10.76%
jan 1, 1999
583.482 bln
-14.363 bln
-2.4%
jan 1, 2000
539.819 bln
-43.663 bln
-7.48%
jan 1, 2001
620.382 bln
+80.563 bln
14.92%
jan 1, 2002
588.515 bln
-31.868 bln
-5.14%
jan 1, 2003
534.125 bln
-54.389 bln
-9.24%
jan 1, 2004
560.414 bln
+26.289 bln
4.92%
jan 1, 2005
675.967 bln
+115.552 bln
20.62%
jan 1, 2006
824.01 bln
+148.043 bln
21.9%
jan 1, 2007
989.764 bln
+165.754 bln
20.12%
jan 1, 2008
1.142 trl
+152.24 bln
15.38%
jan 1, 2009
1.337 trl
+195.418 bln
17.11%
jan 1, 2010
1.153 trl
-184.8 bln
-13.82%
jan 1, 2011
1.504 trl
+351.802 bln
30.52%
jan 1, 2012
1.704 trl
+200.059 bln
13.3%
jan 1, 2013
1.697 trl
-7.58 bln
-0.44%
jan 1, 2014
1.68 trl
-17.385 bln
-1.02%
jan 1, 2015
1.637 trl
-42.924 bln
-2.56%
jan 1, 2016
1.332 trl
-304.586 bln
-18.61%
Ranking of countries by current statistics by years


Comments: