29
/
en
AIzaSyAYiBZKx7MnpbEhh9jyipgxe19OcubqV5w
April 1, 2024
194379
Mauritius
MUS
true
2
1
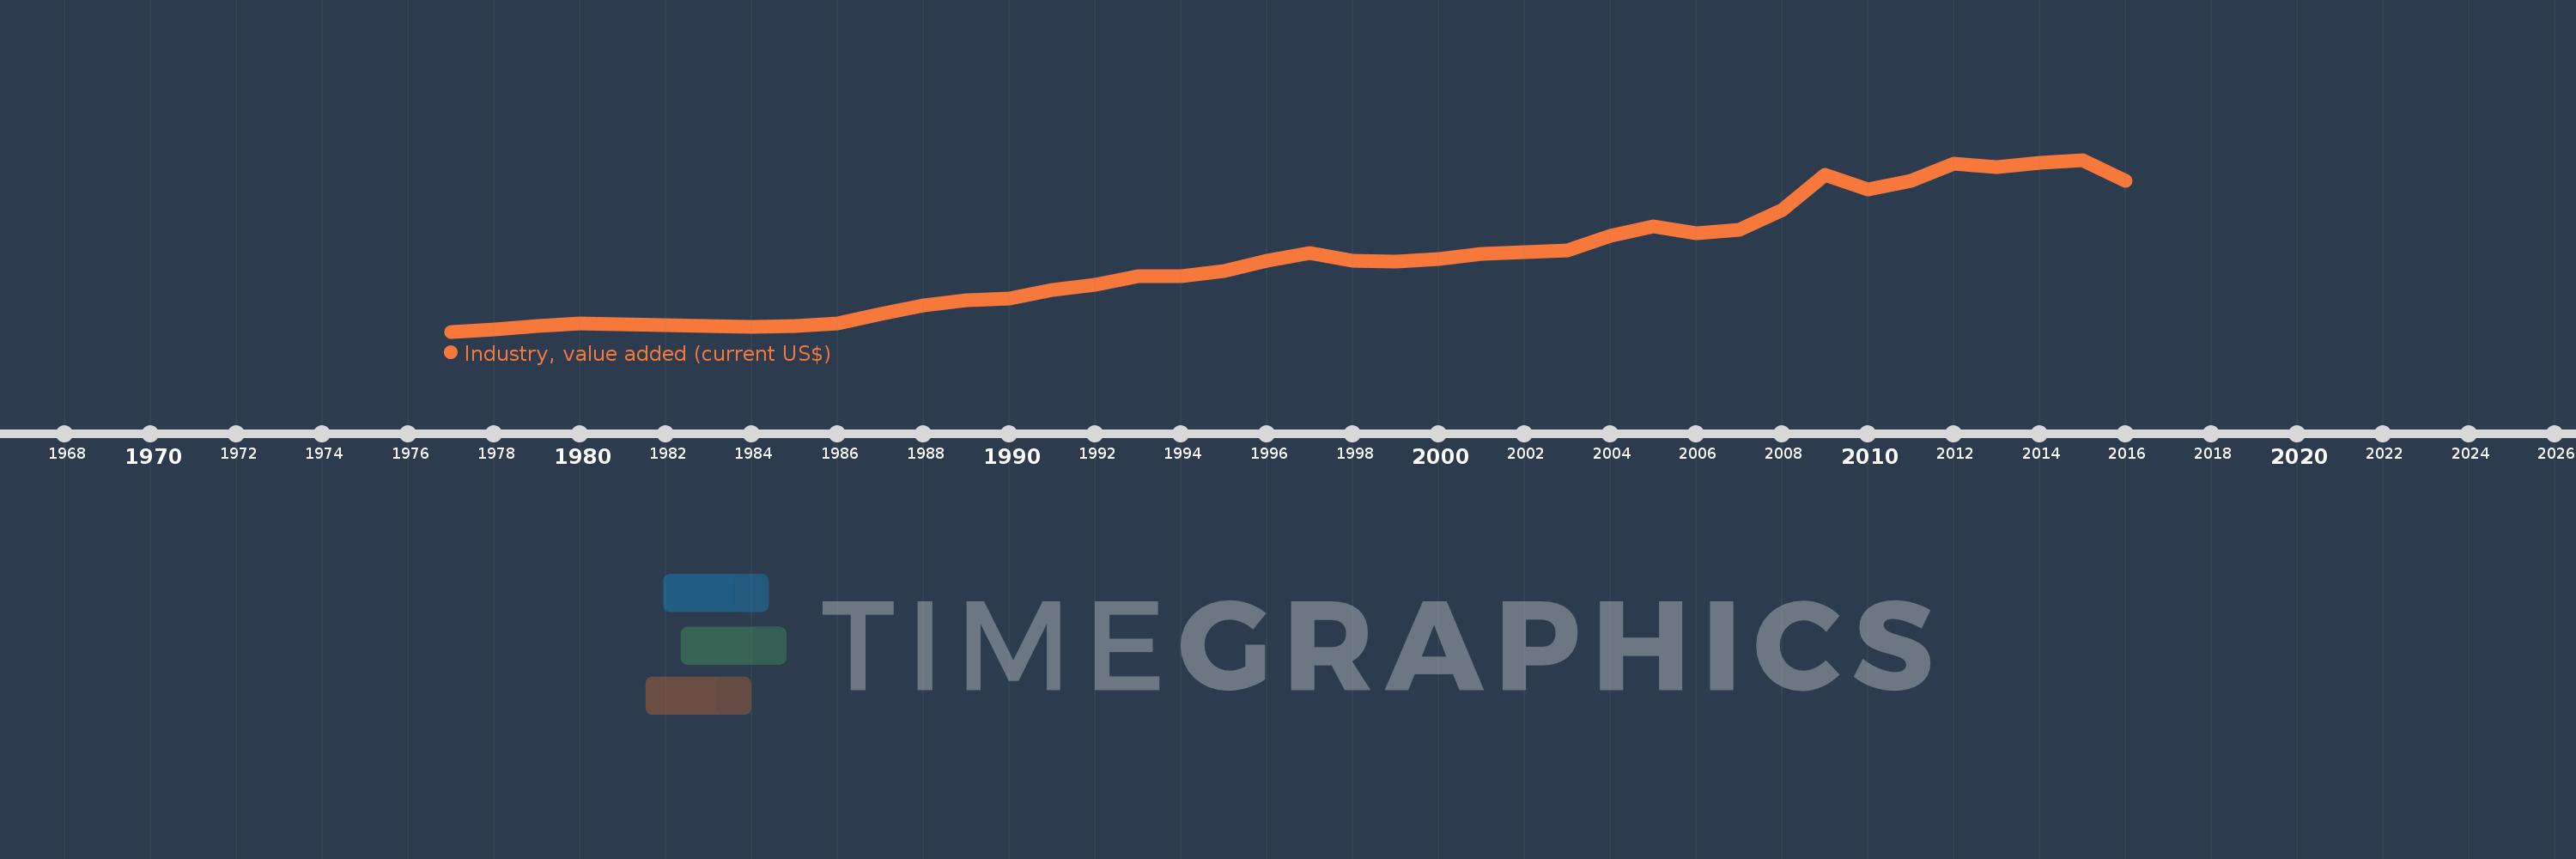
Industry, value added (current US$)
2016,2015,2014,2013,2012,2011,2010,2009,2008,2007,2006,2005,2004,2003,2002,2001,2000,1999,1998,1997,1996,1995,1994,1993,1992,1991,1990,1989,1988,1987,1986,1985,1984,1983,1982,1981,1980,1979,1978,1977
This statistics in other country:
AfghanistanAlbaniaAlgeriaAndorraAngolaAntigua and BarbudaArab WorldArgentinaArmeniaArubaAustraliaAustriaAzerbaijanBahamas, TheBahrainBangladeshBarbadosBelarusBelgiumBelizeBeninBermudaBhutanBoliviaBosnia and HerzegovinaBotswanaBrazilBrunei DarussalamBulgariaBurkina FasoBurundiCabo VerdeCambodiaCameroonCanadaCaribbean small statesCayman IslandsCentral African RepublicCentral Europe and the BalticsChadChileChinaColombiaComorosCongo, Dem. Rep.Congo, Rep.Costa RicaCote d'IvoireCroatiaCubaCyprusCzech RepublicDenmarkDjiboutiDominicaDominican RepublicEarly-demographic dividendEast Asia & PacificEast Asia & Pacific (excluding high income)East Asia & Pacific (IDA & IBRD countries)EcuadorEgypt, Arab Rep.El SalvadorEquatorial GuineaEritreaEstoniaEthiopiaEuro areaEurope & Central AsiaEurope & Central Asia (excluding high income)Europe & Central Asia (IDA & IBRD countries)European UnionFijiFinlandFragile and conflict affected situationsFranceGabonGambia, TheGeorgiaGermanyGhanaGreeceGrenadaGuatemalaGuineaGuinea-BissauGuyanaHeavily indebted poor countries (HIPC)High incomeHondurasHong Kong SAR, ChinaHungaryIBRD onlyIcelandIDA & IBRD totalIDA blendIDA onlyIDA totalIndiaIndonesiaIran, Islamic Rep.IraqIrelandItalyJamaicaJapanJordanKazakhstanKenyaKiribatiKorea, Rep.KosovoKuwaitKyrgyz RepublicLao PDRLate-demographic dividendLatin America & Caribbean Latin America & Caribbean (excluding high income)Latin America & the Caribbean (IDA & IBRD countries)LatviaLeast developed countries: UN classificationLebanonLesothoLiberiaLibyaLiechtensteinLithuaniaLow & middle incomeLow incomeLower middle incomeLuxembourgMacao SAR, ChinaMacedonia, FYRMadagascarMalawiMalaysiaMaldivesMaliMaltaMarshall IslandsMauritaniaMauritiusMexicoMicronesia, Fed. Sts.Middle East & North AfricaMiddle East & North Africa (excluding high income)Middle East & North Africa (IDA & IBRD countries)Middle incomeMoldovaMongoliaMontenegroMoroccoMozambiqueMyanmarNamibiaNepalNetherlandsNew CaledoniaNew ZealandNicaraguaNigerNigeriaNorth AmericaNorwayOECD membersOmanOther small statesPacific island small statesPakistanPalauPanamaPapua New GuineaParaguayPeruPhilippinesPolandPortugalPost-demographic dividendPre-demographic dividendPuerto RicoQatarRomaniaRussian FederationRwandaSamoaSao Tome and PrincipeSaudi ArabiaSenegalSerbiaSeychellesSierra LeoneSingaporeSlovak RepublicSloveniaSmall statesSolomon IslandsSouth AfricaSouth AsiaSouth Asia (IDA & IBRD)SpainSri LankaSt. Kitts and NevisSt. LuciaSt. Vincent and the GrenadinesSub-Saharan Africa Sub-Saharan Africa (excluding high income)Sub-Saharan Africa (IDA & IBRD countries)SudanSurinameSwazilandSwedenSwitzerlandSyrian Arab RepublicTajikistanTanzaniaThailandTimor-LesteTogoTongaTrinidad and TobagoTunisiaTurkeyTurkmenistanTuvaluUgandaUkraineUnited Arab EmiratesUnited KingdomUnited StatesUpper middle incomeUruguayUzbekistanVanuatuVenezuela, RBVietnamWest Bank and GazaWorldYemen, Rep.ZambiaZimbabwe Timeline:
This timeline shows a graph from 1977 to 2016 of Mauritius. No data until 1976. Number of actual observations by date: 40.
Source name:
World Development Indicators
Source organization:
World Bank national accounts data, and OECD National Accounts data files.
Categories, topics:
Economy & Growth
Last updated:
apr 23, 2017
Indicators value changes by year
Minimum:
159.544 mln
jan 1, 1977
Maximum:
2.539 bln
jan 1, 2015
At the date of observation
Value
Absolute change
Change from previous value
jan 1, 1977
159.544 mln
+159.544 mln
0.0%
jan 1, 1978
187.748 mln
+28.204 mln
17.68%
jan 1, 1979
238.009 mln
+50.26 mln
26.77%
jan 1, 1980
275.084 mln
+37.075 mln
15.58%
jan 1, 1981
254.933 mln
-20.151 mln
-7.33%
jan 1, 1982
249.252 mln
-5.681 mln
-2.23%
jan 1, 1983
232.564 mln
-16.687 mln
-6.7%
jan 1, 1984
227.901 mln
-4.664 mln
-2.01%
jan 1, 1985
237.884 mln
+9.983 mln
4.38%
jan 1, 1986
270.731 mln
+32.847 mln
13.81%
jan 1, 1987
398.168 mln
+127.437 mln
47.07%
jan 1, 1988
528.017 mln
+129.849 mln
32.61%
jan 1, 1989
599.782 mln
+71.765 mln
13.59%
jan 1, 1990
612.53 mln
+12.748 mln
2.13%
jan 1, 1991
737.242 mln
+124.713 mln
20.36%
jan 1, 1992
804.86 mln
+67.618 mln
9.17%
jan 1, 1993
921.249 mln
+116.389 mln
14.46%
jan 1, 1994
925.687 mln
+4.438 mln
0.48%
jan 1, 1995
1.001 bln
+75.792 mln
8.19%
jan 1, 1996
1.147 bln
+145.639 mln
14.54%
jan 1, 1997
1.253 bln
+105.692 mln
9.21%
jan 1, 1998
1.14 bln
-112.725 mln
-9.0%
jan 1, 1999
1.13 bln
-9.724 mln
-0.85%
jan 1, 2000
1.165 bln
+34.667 mln
3.07%
jan 1, 2001
1.241 bln
+76.27 mln
6.55%
jan 1, 2002
1.258 bln
+17.014 mln
1.37%
jan 1, 2003
1.285 bln
+26.276 mln
2.09%
jan 1, 2004
1.484 bln
+199.261 mln
15.51%
jan 1, 2005
1.615 bln
+131.141 mln
8.84%
jan 1, 2006
1.516 bln
-98.566 mln
-6.1%
jan 1, 2007
1.57 bln
+53.555 mln
3.53%
jan 1, 2008
1.837 bln
+267.493 mln
17.04%
jan 1, 2009
2.332 bln
+494.04 mln
26.89%
jan 1, 2010
2.132 bln
-199.958 mln
-8.58%
jan 1, 2011
2.248 bln
+116.469 mln
5.46%
jan 1, 2012
2.488 bln
+239.925 mln
10.67%
jan 1, 2013
2.443 bln
-44.552 mln
-1.79%
jan 1, 2014
2.499 bln
+55.384 mln
2.27%
jan 1, 2015
2.539 bln
+40.475 mln
1.62%
jan 1, 2016
2.252 bln
-287.501 mln
-11.32%
Ranking of countries by current statistics by years


Comments: