29
/
en
AIzaSyAYiBZKx7MnpbEhh9jyipgxe19OcubqV5w
April 1, 2024
255329
Swaziland
SWZ
true
2
1
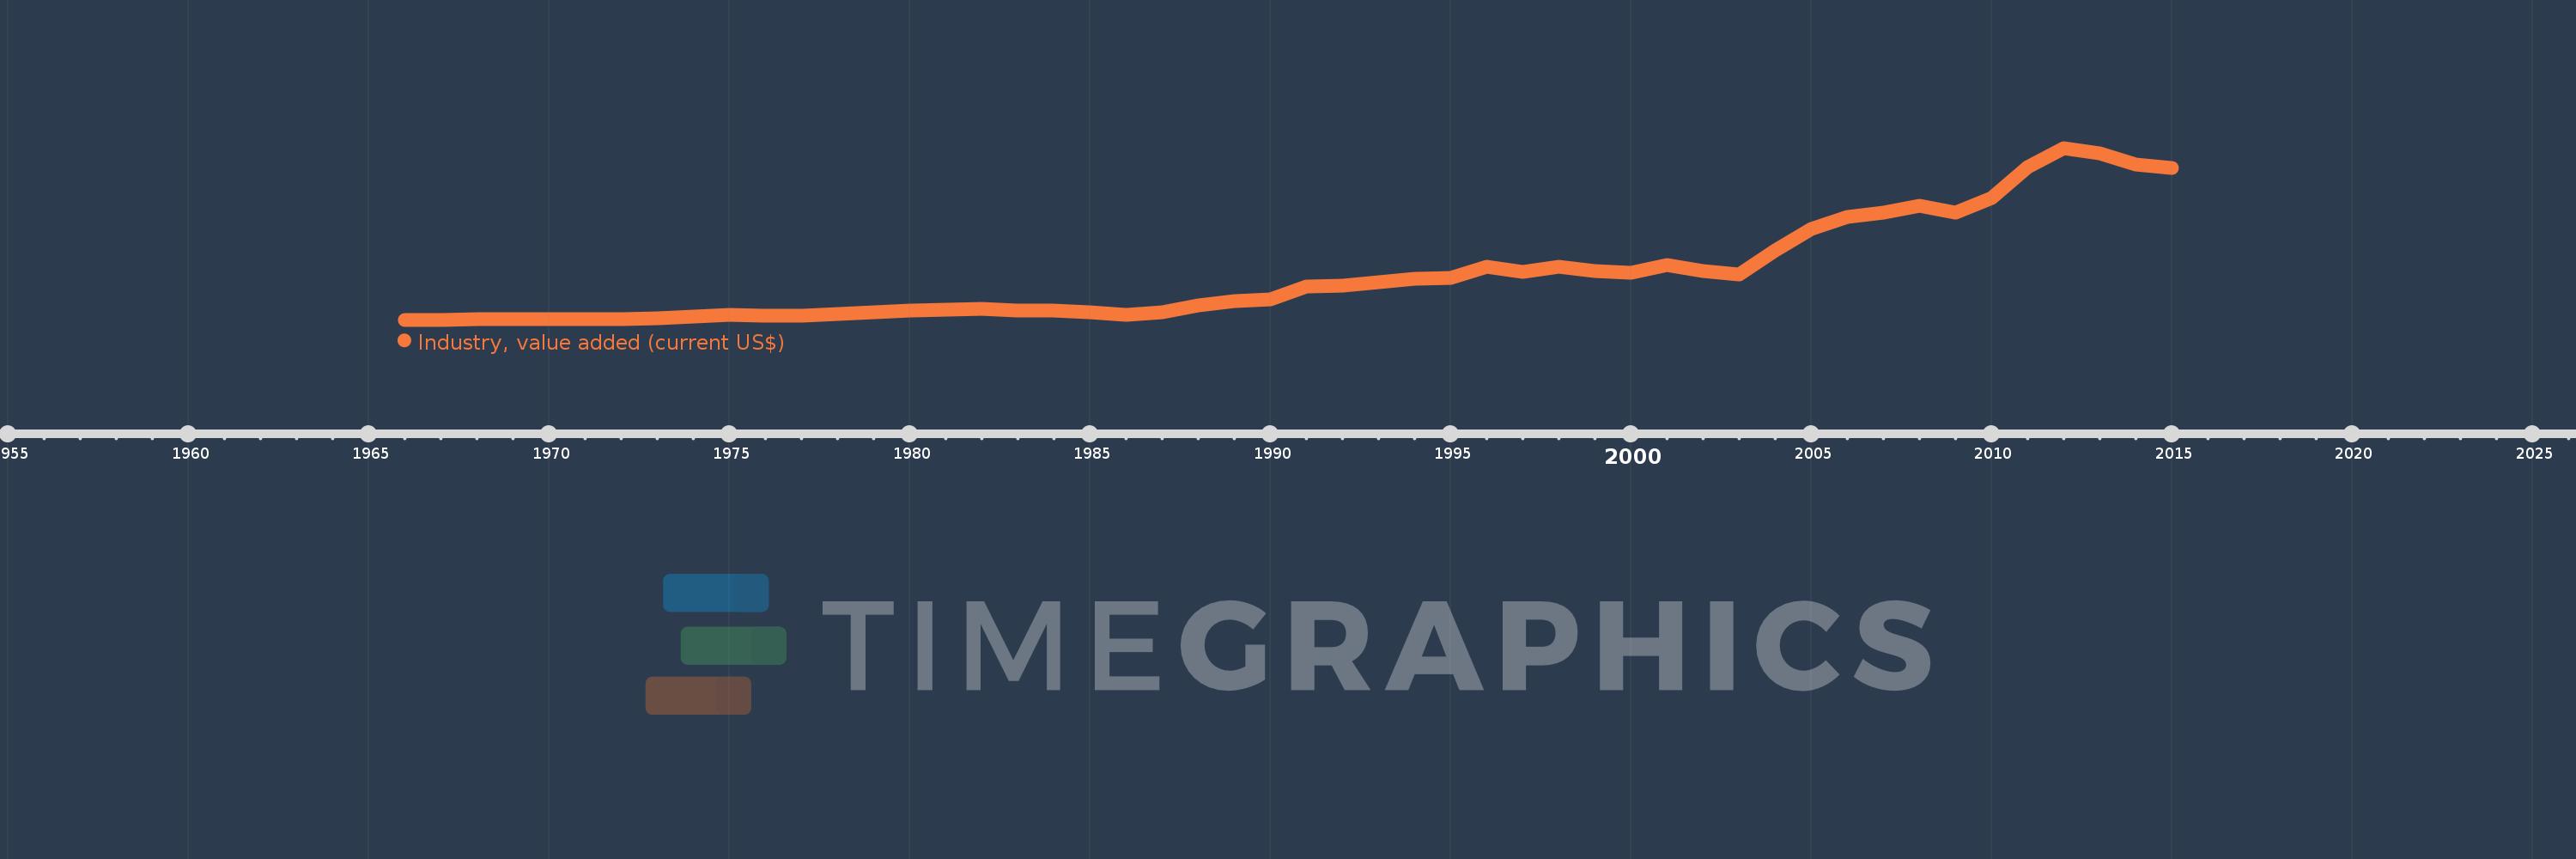
Industry, value added (current US$)
2015,2014,2013,2012,2011,2010,2009,2008,2007,2006,2005,2004,2003,2002,2001,2000,1999,1998,1997,1996,1995,1994,1993,1992,1991,1990,1989,1988,1987,1986,1985,1984,1983,1982,1981,1980,1979,1978,1977,1976,1975,1974,1973,1972,1971,1970,1969,1968,1967,1966
This statistics in other country:
AfghanistanAlbaniaAlgeriaAndorraAngolaAntigua and BarbudaArab WorldArgentinaArmeniaArubaAustraliaAustriaAzerbaijanBahamas, TheBahrainBangladeshBarbadosBelarusBelgiumBelizeBeninBermudaBhutanBoliviaBosnia and HerzegovinaBotswanaBrazilBrunei DarussalamBulgariaBurkina FasoBurundiCabo VerdeCambodiaCameroonCanadaCaribbean small statesCayman IslandsCentral African RepublicCentral Europe and the BalticsChadChileChinaColombiaComorosCongo, Dem. Rep.Congo, Rep.Costa RicaCote d'IvoireCroatiaCubaCyprusCzech RepublicDenmarkDjiboutiDominicaDominican RepublicEarly-demographic dividendEast Asia & PacificEast Asia & Pacific (excluding high income)East Asia & Pacific (IDA & IBRD countries)EcuadorEgypt, Arab Rep.El SalvadorEquatorial GuineaEritreaEstoniaEthiopiaEuro areaEurope & Central AsiaEurope & Central Asia (excluding high income)Europe & Central Asia (IDA & IBRD countries)European UnionFijiFinlandFragile and conflict affected situationsFranceGabonGambia, TheGeorgiaGermanyGhanaGreeceGrenadaGuatemalaGuineaGuinea-BissauGuyanaHeavily indebted poor countries (HIPC)High incomeHondurasHong Kong SAR, ChinaHungaryIBRD onlyIcelandIDA & IBRD totalIDA blendIDA onlyIDA totalIndiaIndonesiaIran, Islamic Rep.IraqIrelandItalyJamaicaJapanJordanKazakhstanKenyaKiribatiKorea, Rep.KosovoKuwaitKyrgyz RepublicLao PDRLate-demographic dividendLatin America & Caribbean Latin America & Caribbean (excluding high income)Latin America & the Caribbean (IDA & IBRD countries)LatviaLeast developed countries: UN classificationLebanonLesothoLiberiaLibyaLiechtensteinLithuaniaLow & middle incomeLow incomeLower middle incomeLuxembourgMacao SAR, ChinaMacedonia, FYRMadagascarMalawiMalaysiaMaldivesMaliMaltaMarshall IslandsMauritaniaMauritiusMexicoMicronesia, Fed. Sts.Middle East & North AfricaMiddle East & North Africa (excluding high income)Middle East & North Africa (IDA & IBRD countries)Middle incomeMoldovaMongoliaMontenegroMoroccoMozambiqueMyanmarNamibiaNepalNetherlandsNew CaledoniaNew ZealandNicaraguaNigerNigeriaNorth AmericaNorwayOECD membersOmanOther small statesPacific island small statesPakistanPalauPanamaPapua New GuineaParaguayPeruPhilippinesPolandPortugalPost-demographic dividendPre-demographic dividendPuerto RicoQatarRomaniaRussian FederationRwandaSamoaSao Tome and PrincipeSaudi ArabiaSenegalSerbiaSeychellesSierra LeoneSingaporeSlovak RepublicSloveniaSmall statesSolomon IslandsSouth AfricaSouth AsiaSouth Asia (IDA & IBRD)SpainSri LankaSt. Kitts and NevisSt. LuciaSt. Vincent and the GrenadinesSub-Saharan Africa Sub-Saharan Africa (excluding high income)Sub-Saharan Africa (IDA & IBRD countries)SudanSurinameSwazilandSwedenSwitzerlandSyrian Arab RepublicTajikistanTanzaniaThailandTimor-LesteTogoTongaTrinidad and TobagoTunisiaTurkeyTurkmenistanTuvaluUgandaUkraineUnited Arab EmiratesUnited KingdomUnited StatesUpper middle incomeUruguayUzbekistanVanuatuVenezuela, RBVietnamWest Bank and GazaWorldYemen, Rep.ZambiaZimbabwe Timeline:
This timeline shows a graph from 1966 to 2015 of Swaziland. No data until 1965. Number of actual observations by date: 50.
Source name:
World Development Indicators
Source organization:
World Bank national accounts data, and OECD National Accounts data files.
Categories, topics:
Economy & Growth
Last updated:
apr 23, 2017
Indicators value changes by year
Minimum:
22.12 mln
jan 1, 1966
Maximum:
2.036 bln
jan 1, 2012
At the date of observation
Value
Absolute change
Change from previous value
jan 1, 1966
22.12 mln
+22.12 mln
0.0%
jan 1, 1967
23.1 mln
+979.98K
4.43%
jan 1, 1968
25.339 mln
+2.24 mln
9.7%
jan 1, 1969
26.039 mln
+699.986K
2.76%
jan 1, 1970
28.979 mln
+2.94 mln
11.29%
jan 1, 1971
29.119 mln
+139.997K
0.48%
jan 1, 1972
30.481 mln
+1.362 mln
4.68%
jan 1, 1973
35.515 mln
+5.034 mln
16.51%
jan 1, 1974
64.265 mln
+28.751 mln
80.95%
jan 1, 1975
75.35 mln
+11.084 mln
17.25%
jan 1, 1976
71.67 mln
-3.679 mln
-4.88%
jan 1, 1977
73.597 mln
+1.927 mln
2.69%
jan 1, 1978
87.397 mln
+13.799 mln
18.75%
jan 1, 1979
109.246 mln
+21.849 mln
25.0%
jan 1, 1980
128.297 mln
+19.051 mln
17.44%
jan 1, 1981
140.606 mln
+12.31 mln
9.59%
jan 1, 1982
146.508 mln
+5.902 mln
4.2%
jan 1, 1983
128.661 mln
-17.848 mln
-12.18%
jan 1, 1984
125.662 mln
-2.999 mln
-2.33%
jan 1, 1985
111.299 mln
-14.363 mln
-11.43%
jan 1, 1986
77.061 mln
-34.238 mln
-30.76%
jan 1, 1987
113.217 mln
+36.155 mln
46.92%
jan 1, 1988
186.493 mln
+73.276 mln
64.72%
jan 1, 1989
244.073 mln
+57.58 mln
30.88%
jan 1, 1990
260.533 mln
+16.46 mln
6.74%
jan 1, 1991
410.528 mln
+149.995 mln
57.57%
jan 1, 1992
418.807 mln
+8.278 mln
2.02%
jan 1, 1993
464.176 mln
+45.369 mln
10.83%
jan 1, 1994
499.927 mln
+35.751 mln
7.7%
jan 1, 1995
511.074 mln
+11.147 mln
2.23%
jan 1, 1996
641.242 mln
+130.169 mln
25.47%
jan 1, 1997
582.665 mln
-58.577 mln
-9.13%
jan 1, 1998
646.33 mln
+63.665 mln
10.93%
jan 1, 1999
594.063 mln
-52.267 mln
-8.09%
jan 1, 2000
568.712 mln
-25.35 mln
-4.27%
jan 1, 2001
661.953 mln
+93.241 mln
16.4%
jan 1, 2002
590.586 mln
-71.367 mln
-10.78%
jan 1, 2003
549.593 mln
-40.993 mln
-6.94%
jan 1, 2004
830.819 mln
+281.226 mln
51.17%
jan 1, 2005
1.086 bln
+255.572 mln
30.76%
jan 1, 2006
1.23 bln
+143.677 mln
13.23%
jan 1, 2007
1.273 bln
+42.988 mln
3.49%
jan 1, 2008
1.357 bln
+83.894 mln
6.59%
jan 1, 2009
1.275 bln
-82.025 mln
-6.04%
jan 1, 2010
1.447 bln
+172.349 mln
13.52%
jan 1, 2011
1.815 bln
+367.312 mln
25.38%
jan 1, 2012
2.036 bln
+221.123 mln
12.19%
jan 1, 2013
1.97 bln
-66.119 mln
-3.25%
jan 1, 2014
1.844 bln
-125.803 mln
-6.39%
jan 1, 2015
1.805 bln
-38.444 mln
-2.09%
Ranking of countries by current statistics by years


Comments: