29
/
en
AIzaSyAYiBZKx7MnpbEhh9jyipgxe19OcubqV5w
April 1, 2024
177805
Lesotho
LSO
true
2
1
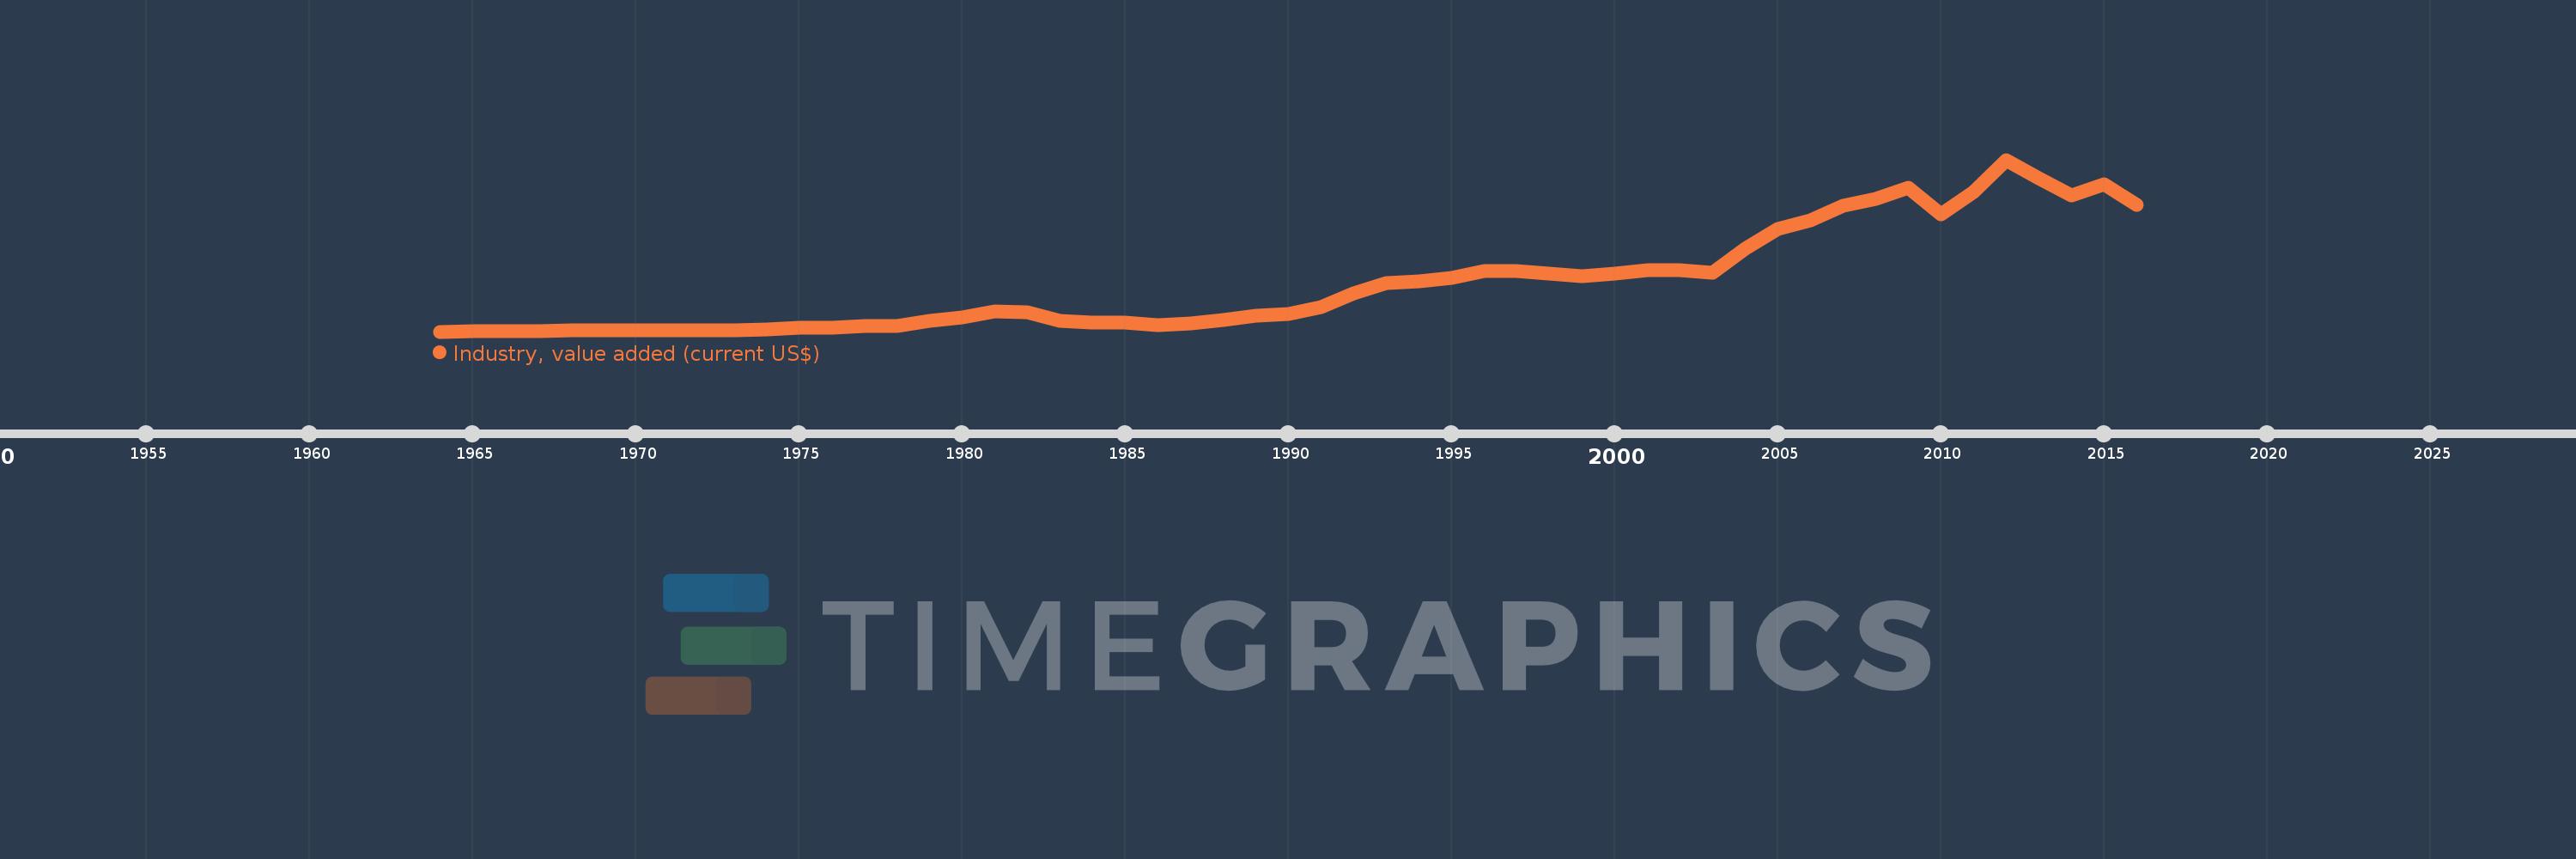
Industry, value added (current US$)
2016,2015,2014,2013,2012,2011,2010,2009,2008,2007,2006,2005,2004,2003,2002,2001,2000,1999,1998,1997,1996,1995,1994,1993,1992,1991,1990,1989,1988,1987,1986,1985,1984,1983,1982,1981,1980,1979,1978,1977,1976,1975,1974,1973,1972,1971,1970,1969,1968,1967,1966,1965,1964
This statistics in other country:
AfghanistanAlbaniaAlgeriaAndorraAngolaAntigua and BarbudaArab WorldArgentinaArmeniaArubaAustraliaAustriaAzerbaijanBahamas, TheBahrainBangladeshBarbadosBelarusBelgiumBelizeBeninBermudaBhutanBoliviaBosnia and HerzegovinaBotswanaBrazilBrunei DarussalamBulgariaBurkina FasoBurundiCabo VerdeCambodiaCameroonCanadaCaribbean small statesCayman IslandsCentral African RepublicCentral Europe and the BalticsChadChileChinaColombiaComorosCongo, Dem. Rep.Congo, Rep.Costa RicaCote d'IvoireCroatiaCubaCyprusCzech RepublicDenmarkDjiboutiDominicaDominican RepublicEarly-demographic dividendEast Asia & PacificEast Asia & Pacific (excluding high income)East Asia & Pacific (IDA & IBRD countries)EcuadorEgypt, Arab Rep.El SalvadorEquatorial GuineaEritreaEstoniaEthiopiaEuro areaEurope & Central AsiaEurope & Central Asia (excluding high income)Europe & Central Asia (IDA & IBRD countries)European UnionFijiFinlandFragile and conflict affected situationsFranceGabonGambia, TheGeorgiaGermanyGhanaGreeceGrenadaGuatemalaGuineaGuinea-BissauGuyanaHeavily indebted poor countries (HIPC)High incomeHondurasHong Kong SAR, ChinaHungaryIBRD onlyIcelandIDA & IBRD totalIDA blendIDA onlyIDA totalIndiaIndonesiaIran, Islamic Rep.IraqIrelandItalyJamaicaJapanJordanKazakhstanKenyaKiribatiKorea, Rep.KosovoKuwaitKyrgyz RepublicLao PDRLate-demographic dividendLatin America & Caribbean Latin America & Caribbean (excluding high income)Latin America & the Caribbean (IDA & IBRD countries)LatviaLeast developed countries: UN classificationLebanonLesothoLiberiaLibyaLiechtensteinLithuaniaLow & middle incomeLow incomeLower middle incomeLuxembourgMacao SAR, ChinaMacedonia, FYRMadagascarMalawiMalaysiaMaldivesMaliMaltaMarshall IslandsMauritaniaMauritiusMexicoMicronesia, Fed. Sts.Middle East & North AfricaMiddle East & North Africa (excluding high income)Middle East & North Africa (IDA & IBRD countries)Middle incomeMoldovaMongoliaMontenegroMoroccoMozambiqueMyanmarNamibiaNepalNetherlandsNew CaledoniaNew ZealandNicaraguaNigerNigeriaNorth AmericaNorwayOECD membersOmanOther small statesPacific island small statesPakistanPalauPanamaPapua New GuineaParaguayPeruPhilippinesPolandPortugalPost-demographic dividendPre-demographic dividendPuerto RicoQatarRomaniaRussian FederationRwandaSamoaSao Tome and PrincipeSaudi ArabiaSenegalSerbiaSeychellesSierra LeoneSingaporeSlovak RepublicSloveniaSmall statesSolomon IslandsSouth AfricaSouth AsiaSouth Asia (IDA & IBRD)SpainSri LankaSt. Kitts and NevisSt. LuciaSt. Vincent and the GrenadinesSub-Saharan Africa Sub-Saharan Africa (excluding high income)Sub-Saharan Africa (IDA & IBRD countries)SudanSurinameSwazilandSwedenSwitzerlandSyrian Arab RepublicTajikistanTanzaniaThailandTimor-LesteTogoTongaTrinidad and TobagoTunisiaTurkeyTurkmenistanTuvaluUgandaUkraineUnited Arab EmiratesUnited KingdomUnited StatesUpper middle incomeUruguayUzbekistanVanuatuVenezuela, RBVietnamWest Bank and GazaWorldYemen, Rep.ZambiaZimbabwe Timeline:
This timeline shows a graph from 1964 to 2016 of Lesotho. No data until 1963. Number of actual observations by date: 53.
Source name:
World Development Indicators
Source organization:
World Bank national accounts data, and OECD National Accounts data files.
Categories, topics:
Economy & Growth
Last updated:
apr 23, 2017
Indicators value changes by year
Minimum:
1.113 mln
jan 1, 1964
Maximum:
873.663 mln
jan 1, 2012
At the date of observation
Value
Absolute change
Change from previous value
jan 1, 1964
1.113 mln
+1.113 mln
0.0%
jan 1, 1965
1.907 mln
+794.624K
71.42%
jan 1, 1966
2.861 mln
+953.661K
50.0%
jan 1, 1967
3.815 mln
+953.661K
33.33%
jan 1, 1968
6.993 mln
+3.179 mln
83.33%
jan 1, 1969
6.357 mln
-635.867K
-9.09%
jan 1, 1970
7.47 mln
+1.113 mln
17.5%
jan 1, 1971
6.993 mln
-476.83K
-6.38%
jan 1, 1972
7.778 mln
+784.824K
11.22%
jan 1, 1973
8.861 mln
+1.083 mln
13.93%
jan 1, 1974
13.578 mln
+4.716 mln
53.22%
jan 1, 1975
18.88 mln
+5.302 mln
39.05%
jan 1, 1976
19.804 mln
+924.575K
4.9%
jan 1, 1977
28.33 mln
+8.526 mln
43.05%
jan 1, 1978
29.244 mln
+913.868K
3.23%
jan 1, 1979
56.79 mln
+27.547 mln
94.2%
jan 1, 1980
72.809 mln
+16.019 mln
28.21%
jan 1, 1981
104.374 mln
+31.565 mln
43.35%
jan 1, 1982
97.134 mln
-7.24 mln
-6.94%
jan 1, 1983
53.681 mln
-43.453 mln
-44.73%
jan 1, 1984
47.623 mln
-6.058 mln
-11.29%
jan 1, 1985
45.066 mln
-2.557 mln
-5.37%
jan 1, 1986
34.524 mln
-10.543 mln
-23.39%
jan 1, 1987
44.666 mln
+10.142 mln
29.38%
jan 1, 1988
58.653 mln
+13.987 mln
31.32%
jan 1, 1989
82.631 mln
+23.978 mln
40.88%
jan 1, 1990
92.647 mln
+10.016 mln
12.12%
jan 1, 1991
127.356 mln
+34.709 mln
37.46%
jan 1, 1992
196.138 mln
+68.782 mln
54.01%
jan 1, 1993
246.216 mln
+50.078 mln
25.53%
jan 1, 1994
256.585 mln
+10.369 mln
4.21%
jan 1, 1995
273.484 mln
+16.899 mln
6.59%
jan 1, 1996
309.451 mln
+35.967 mln
13.15%
jan 1, 1997
307.293 mln
-2.158 mln
-0.7%
jan 1, 1998
295.856 mln
-11.436 mln
-3.72%
jan 1, 1999
281.387 mln
-14.47 mln
-4.89%
jan 1, 2000
294.335 mln
+12.948 mln
4.6%
jan 1, 2001
312.011 mln
+17.676 mln
6.01%
jan 1, 2002
313.703 mln
+1.692 mln
0.54%
jan 1, 2003
300.228 mln
-13.475 mln
-4.3%
jan 1, 2004
422.265 mln
+122.037 mln
40.65%
jan 1, 2005
523.875 mln
+101.61 mln
24.06%
jan 1, 2006
568.132 mln
+44.257 mln
8.45%
jan 1, 2007
638.701 mln
+70.57 mln
12.42%
jan 1, 2008
673.566 mln
+34.864 mln
5.46%
jan 1, 2009
732.128 mln
+58.562 mln
8.69%
jan 1, 2010
595.758 mln
-136.37 mln
-18.63%
jan 1, 2011
710.993 mln
+115.235 mln
19.34%
jan 1, 2012
873.663 mln
+162.67 mln
22.88%
jan 1, 2013
781.094 mln
-92.568 mln
-10.6%
jan 1, 2014
691.831 mln
-89.263 mln
-11.43%
jan 1, 2015
749.512 mln
+57.681 mln
8.34%
jan 1, 2016
643.612 mln
-105.9 mln
-14.13%
Ranking of countries by current statistics by years


Comments: