29
/
en
AIzaSyAYiBZKx7MnpbEhh9jyipgxe19OcubqV5w
April 1, 2024
113738
Cote d'Ivoire
CIV
true
2
1
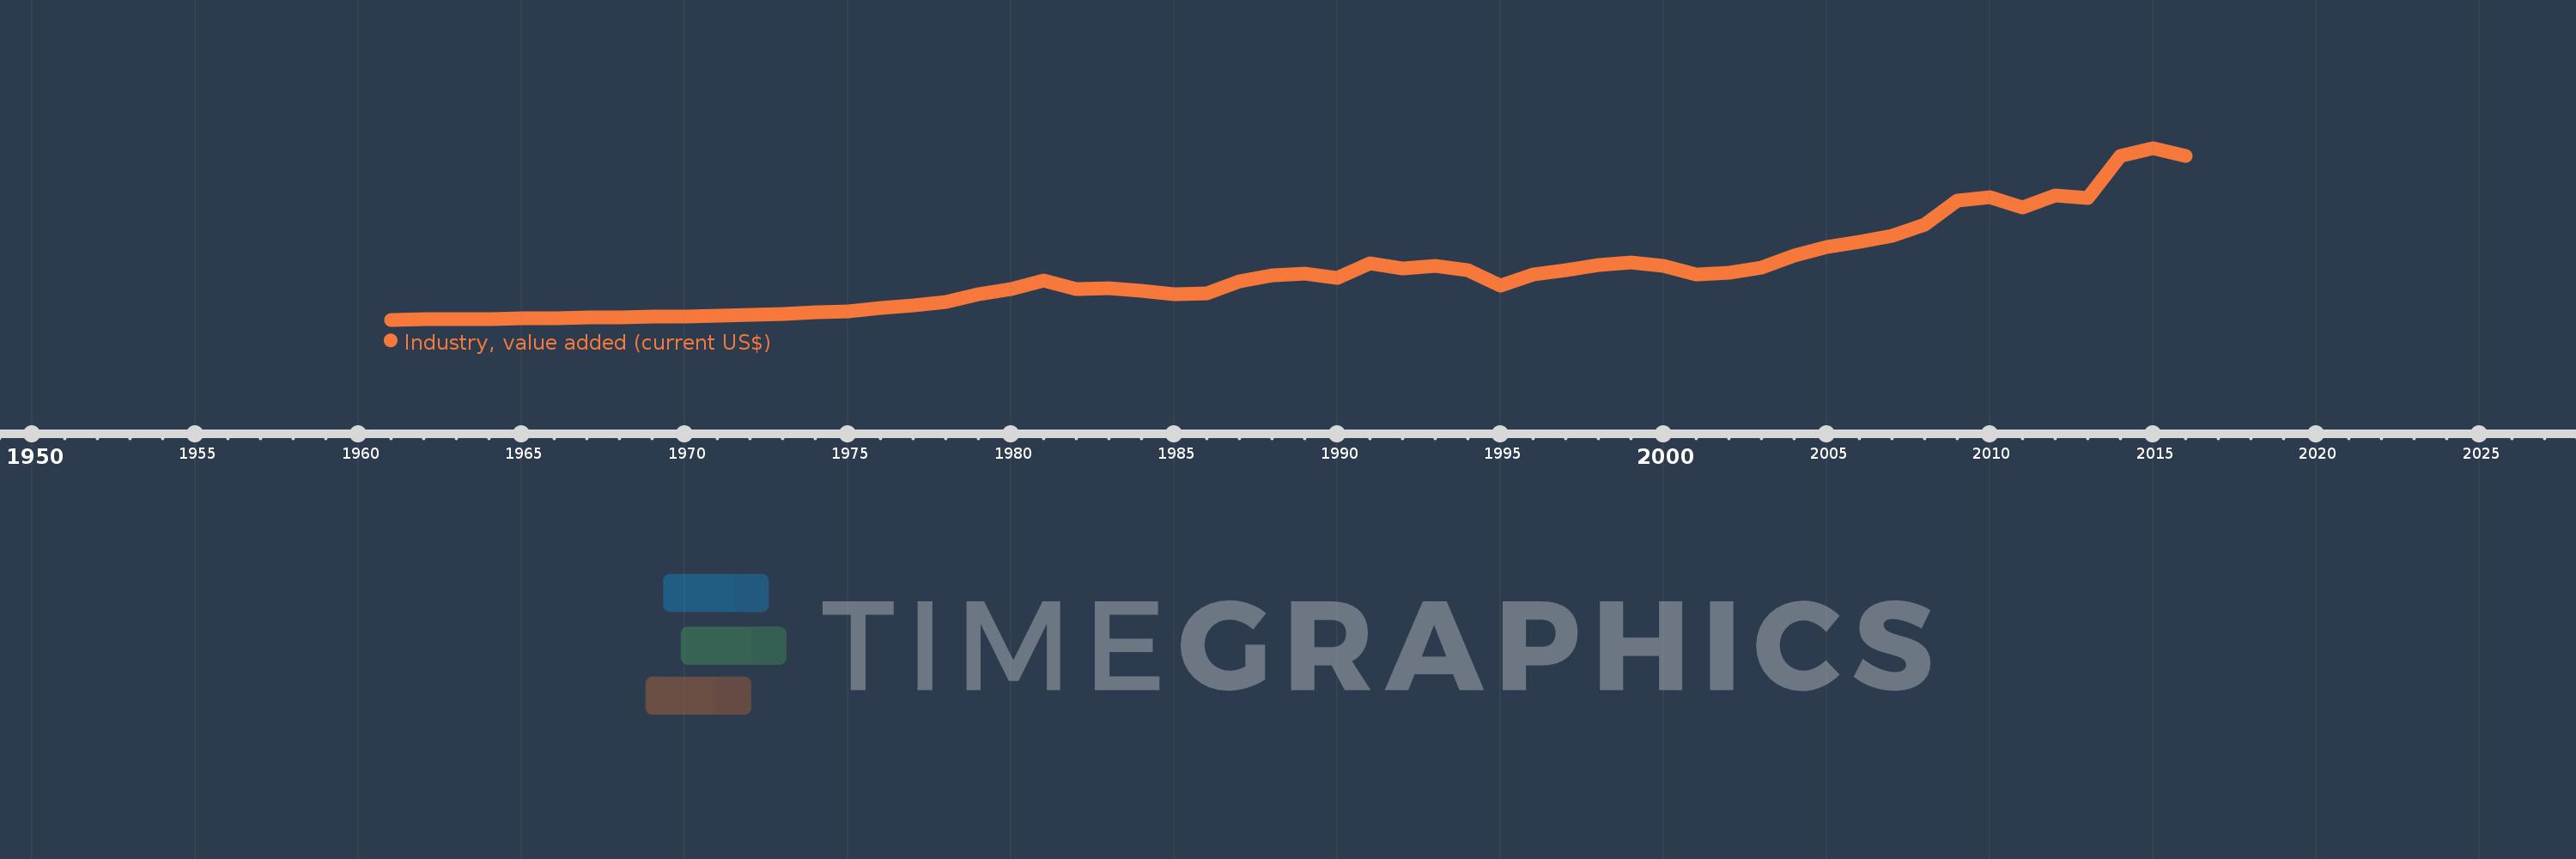
Industry, value added (current US$)
2016,2015,2014,2013,2012,2011,2010,2009,2008,2007,2006,2005,2004,2003,2002,2001,2000,1999,1998,1997,1996,1995,1994,1993,1992,1991,1990,1989,1988,1987,1986,1985,1984,1983,1982,1981,1980,1979,1978,1977,1976,1975,1974,1973,1972,1971,1970,1969,1968,1967,1966,1965,1964,1963,1962,1961
This statistics in other country:
AfghanistanAlbaniaAlgeriaAndorraAngolaAntigua and BarbudaArab WorldArgentinaArmeniaArubaAustraliaAustriaAzerbaijanBahamas, TheBahrainBangladeshBarbadosBelarusBelgiumBelizeBeninBermudaBhutanBoliviaBosnia and HerzegovinaBotswanaBrazilBrunei DarussalamBulgariaBurkina FasoBurundiCabo VerdeCambodiaCameroonCanadaCaribbean small statesCayman IslandsCentral African RepublicCentral Europe and the BalticsChadChileChinaColombiaComorosCongo, Dem. Rep.Congo, Rep.Costa RicaCote d'IvoireCroatiaCubaCyprusCzech RepublicDenmarkDjiboutiDominicaDominican RepublicEarly-demographic dividendEast Asia & PacificEast Asia & Pacific (excluding high income)East Asia & Pacific (IDA & IBRD countries)EcuadorEgypt, Arab Rep.El SalvadorEquatorial GuineaEritreaEstoniaEthiopiaEuro areaEurope & Central AsiaEurope & Central Asia (excluding high income)Europe & Central Asia (IDA & IBRD countries)European UnionFijiFinlandFragile and conflict affected situationsFranceGabonGambia, TheGeorgiaGermanyGhanaGreeceGrenadaGuatemalaGuineaGuinea-BissauGuyanaHeavily indebted poor countries (HIPC)High incomeHondurasHong Kong SAR, ChinaHungaryIBRD onlyIcelandIDA & IBRD totalIDA blendIDA onlyIDA totalIndiaIndonesiaIran, Islamic Rep.IraqIrelandItalyJamaicaJapanJordanKazakhstanKenyaKiribatiKorea, Rep.KosovoKuwaitKyrgyz RepublicLao PDRLate-demographic dividendLatin America & Caribbean Latin America & Caribbean (excluding high income)Latin America & the Caribbean (IDA & IBRD countries)LatviaLeast developed countries: UN classificationLebanonLesothoLiberiaLibyaLiechtensteinLithuaniaLow & middle incomeLow incomeLower middle incomeLuxembourgMacao SAR, ChinaMacedonia, FYRMadagascarMalawiMalaysiaMaldivesMaliMaltaMarshall IslandsMauritaniaMauritiusMexicoMicronesia, Fed. Sts.Middle East & North AfricaMiddle East & North Africa (excluding high income)Middle East & North Africa (IDA & IBRD countries)Middle incomeMoldovaMongoliaMontenegroMoroccoMozambiqueMyanmarNamibiaNepalNetherlandsNew CaledoniaNew ZealandNicaraguaNigerNigeriaNorth AmericaNorwayOECD membersOmanOther small statesPacific island small statesPakistanPalauPanamaPapua New GuineaParaguayPeruPhilippinesPolandPortugalPost-demographic dividendPre-demographic dividendPuerto RicoQatarRomaniaRussian FederationRwandaSamoaSao Tome and PrincipeSaudi ArabiaSenegalSerbiaSeychellesSierra LeoneSingaporeSlovak RepublicSloveniaSmall statesSolomon IslandsSouth AfricaSouth AsiaSouth Asia (IDA & IBRD)SpainSri LankaSt. Kitts and NevisSt. LuciaSt. Vincent and the GrenadinesSub-Saharan Africa Sub-Saharan Africa (excluding high income)Sub-Saharan Africa (IDA & IBRD countries)SudanSurinameSwazilandSwedenSwitzerlandSyrian Arab RepublicTajikistanTanzaniaThailandTimor-LesteTogoTongaTrinidad and TobagoTunisiaTurkeyTurkmenistanTuvaluUgandaUkraineUnited Arab EmiratesUnited KingdomUnited StatesUpper middle incomeUruguayUzbekistanVanuatuVenezuela, RBVietnamWest Bank and GazaWorldYemen, Rep.ZambiaZimbabwe Timeline:
This timeline shows a graph from 1961 to 2016 of Cote d'Ivoire. No data until 1960. Number of actual observations by date: 56.
Source name:
World Development Indicators
Source organization:
World Bank national accounts data, and OECD National Accounts data files.
Categories, topics:
Economy & Growth
Last updated:
apr 23, 2017
Indicators value changes by year
Minimum:
71.765 mln
jan 1, 1961
Maximum:
8.487 bln
jan 1, 2015
At the date of observation
Value
Absolute change
Change from previous value
jan 1, 1961
71.765 mln
+71.765 mln
0.0%
jan 1, 1962
85.806 mln
+14.042 mln
19.57%
jan 1, 1963
90.223 mln
+4.417 mln
5.15%
jan 1, 1964
111.875 mln
+21.652 mln
24.0%
jan 1, 1965
147.958 mln
+36.082 mln
32.25%
jan 1, 1966
146.494 mln
-1.464 mln
-0.99%
jan 1, 1967
183.166 mln
+36.672 mln
25.03%
jan 1, 1968
204.471 mln
+21.305 mln
11.63%
jan 1, 1969
208.834 mln
+4.364 mln
2.13%
jan 1, 1970
210.032 mln
+1.198 mln
0.57%
jan 1, 1971
269.172 mln
+59.14 mln
28.16%
jan 1, 1972
311.959 mln
+42.787 mln
15.9%
jan 1, 1973
365.039 mln
+53.08 mln
17.02%
jan 1, 1974
445.064 mln
+80.025 mln
21.92%
jan 1, 1975
493.966 mln
+48.902 mln
10.99%
jan 1, 1976
663.516 mln
+169.55 mln
34.32%
jan 1, 1977
762.92 mln
+99.404 mln
14.98%
jan 1, 1978
949.61 mln
+186.691 mln
24.47%
jan 1, 1979
1.302 bln
+352.372 mln
37.11%
jan 1, 1980
1.56 bln
+257.803 mln
19.8%
jan 1, 1981
2.009 bln
+448.927 mln
28.78%
jan 1, 1982
1.567 bln
-441.257 mln
-21.97%
jan 1, 1983
1.611 bln
+43.439 mln
2.77%
jan 1, 1984
1.469 bln
-142.015 mln
-8.82%
jan 1, 1985
1.337 bln
-131.456 mln
-8.95%
jan 1, 1986
1.378 bln
+40.389 mln
3.02%
jan 1, 1987
1.949 bln
+571.297 mln
41.46%
jan 1, 1988
2.256 bln
+306.979 mln
15.75%
jan 1, 1989
2.323 bln
+66.793 mln
2.96%
jan 1, 1990
2.126 bln
-197.356 mln
-8.5%
jan 1, 1991
2.836 bln
+710.244 mln
33.41%
jan 1, 1992
2.581 bln
-254.743 mln
-8.98%
jan 1, 1993
2.726 bln
+144.984 mln
5.62%
jan 1, 1994
2.513 bln
-212.669 mln
-7.8%
jan 1, 1995
1.749 bln
-764.182 mln
-30.41%
jan 1, 1996
2.285 bln
+535.353 mln
30.61%
jan 1, 1997
2.479 bln
+194.121 mln
8.5%
jan 1, 1998
2.772 bln
+293.659 mln
11.85%
jan 1, 1999
2.873 bln
+100.45 mln
3.62%
jan 1, 2000
2.711 bln
-161.456 mln
-5.62%
jan 1, 2001
2.305 bln
-406.644 mln
-15.0%
jan 1, 2002
2.381 bln
+76.778 mln
3.33%
jan 1, 2003
2.606 bln
+224.262 mln
9.42%
jan 1, 2004
3.226 bln
+619.96 mln
23.79%
jan 1, 2005
3.644 bln
+418.088 mln
12.96%
jan 1, 2006
3.898 bln
+254.514 mln
6.98%
jan 1, 2007
4.189 bln
+290.692 mln
7.46%
jan 1, 2008
4.734 bln
+545.379 mln
13.02%
jan 1, 2009
5.909 bln
+1.174 bln
24.81%
jan 1, 2010
6.081 bln
+171.97 mln
2.91%
jan 1, 2011
5.576 bln
-504.492 mln
-8.3%
jan 1, 2012
6.146 bln
+569.756 mln
10.22%
jan 1, 2013
6.042 bln
-104.383 mln
-1.7%
jan 1, 2014
8.113 bln
+2.072 bln
34.29%
jan 1, 2015
8.487 bln
+373.898 mln
4.61%
jan 1, 2016
8.092 bln
-395.436 mln
-4.66%
Ranking of countries by current statistics by years


Comments: