29
/
en
AIzaSyAYiBZKx7MnpbEhh9jyipgxe19OcubqV5w
April 1, 2024
270637
Turkmenistan
TKM
true
2
1
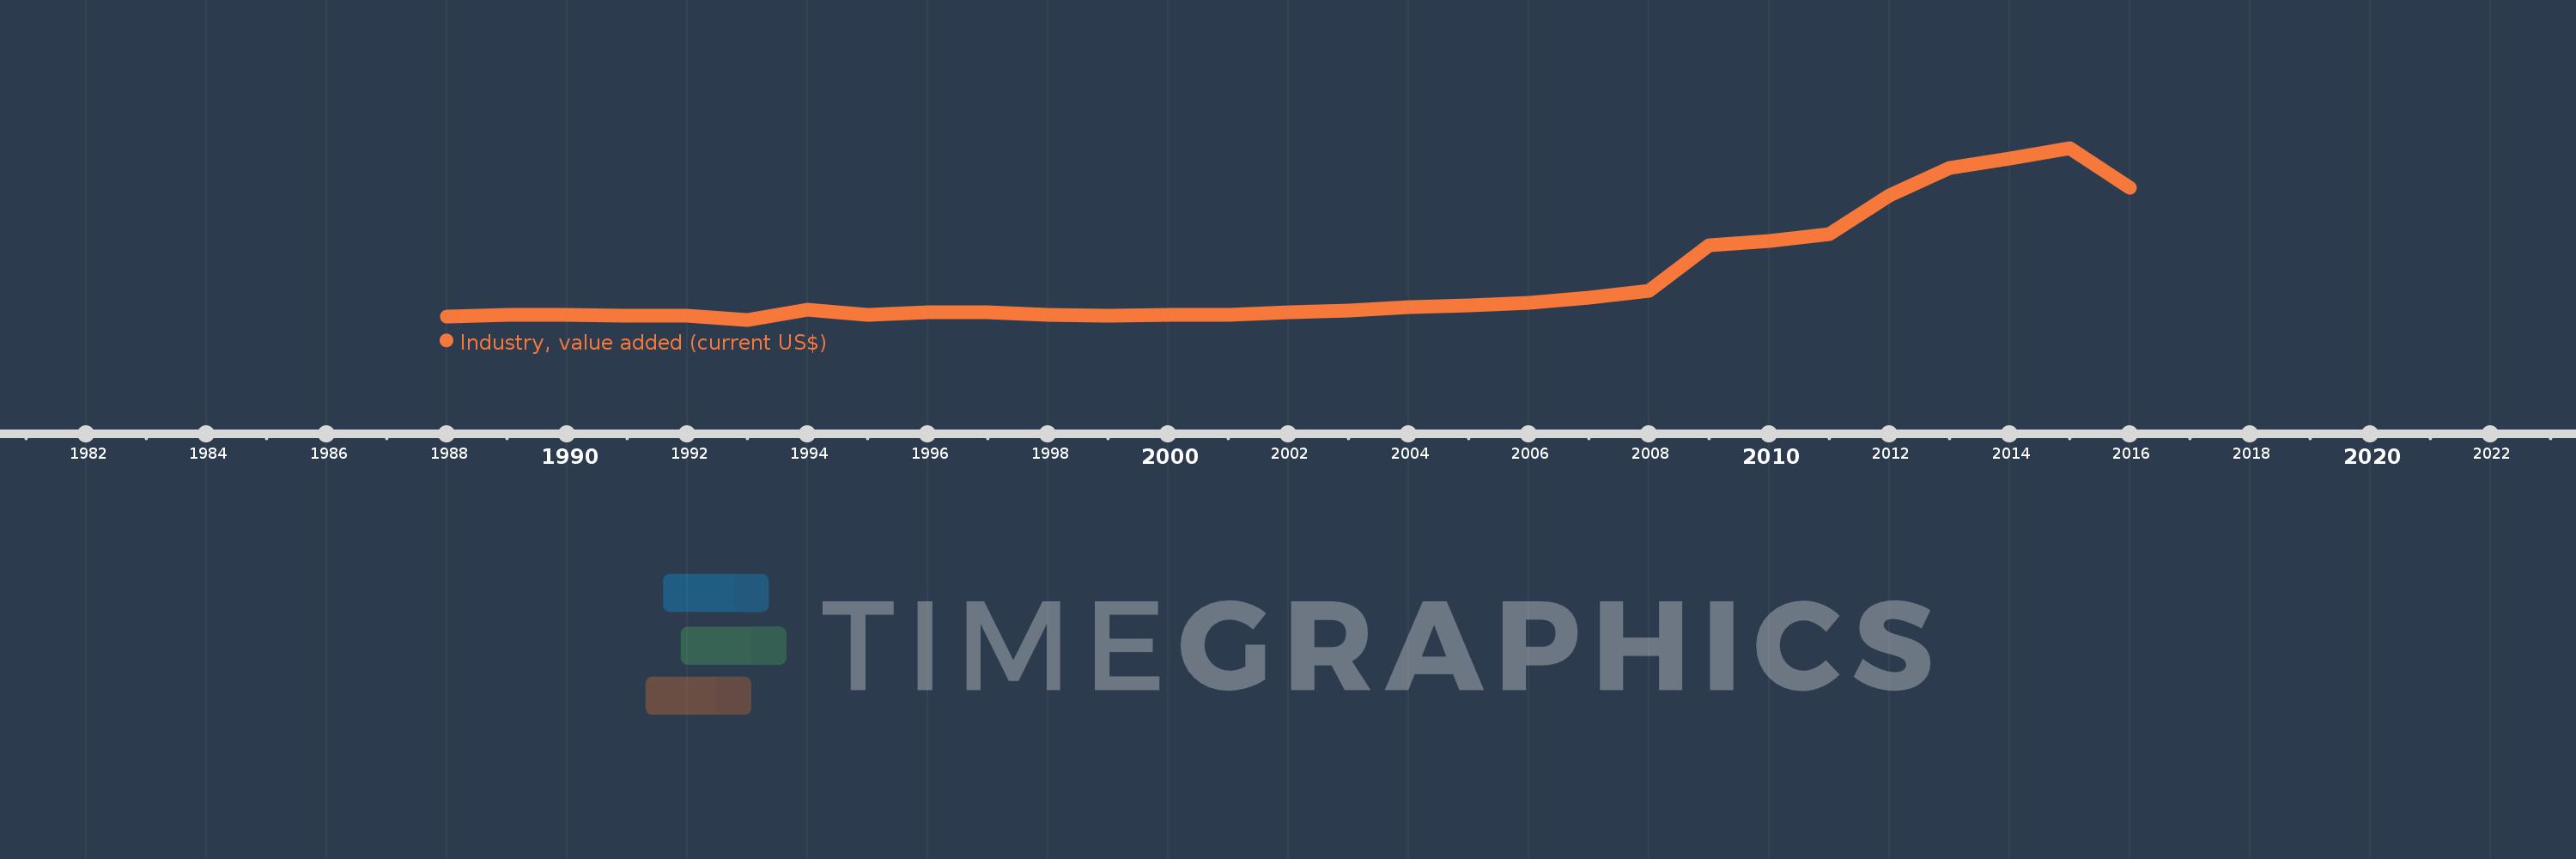
Industry, value added (current US$)
2016,2015,2014,2013,2012,2011,2010,2009,2008,2007,2006,2005,2004,2003,2002,2001,2000,1999,1998,1997,1996,1995,1994,1993,1992,1991,1990,1989,1988
This statistics in other country:
AfghanistanAlbaniaAlgeriaAndorraAngolaAntigua and BarbudaArab WorldArgentinaArmeniaArubaAustraliaAustriaAzerbaijanBahamas, TheBahrainBangladeshBarbadosBelarusBelgiumBelizeBeninBermudaBhutanBoliviaBosnia and HerzegovinaBotswanaBrazilBrunei DarussalamBulgariaBurkina FasoBurundiCabo VerdeCambodiaCameroonCanadaCaribbean small statesCayman IslandsCentral African RepublicCentral Europe and the BalticsChadChileChinaColombiaComorosCongo, Dem. Rep.Congo, Rep.Costa RicaCote d'IvoireCroatiaCubaCyprusCzech RepublicDenmarkDjiboutiDominicaDominican RepublicEarly-demographic dividendEast Asia & PacificEast Asia & Pacific (excluding high income)East Asia & Pacific (IDA & IBRD countries)EcuadorEgypt, Arab Rep.El SalvadorEquatorial GuineaEritreaEstoniaEthiopiaEuro areaEurope & Central AsiaEurope & Central Asia (excluding high income)Europe & Central Asia (IDA & IBRD countries)European UnionFijiFinlandFragile and conflict affected situationsFranceGabonGambia, TheGeorgiaGermanyGhanaGreeceGrenadaGuatemalaGuineaGuinea-BissauGuyanaHeavily indebted poor countries (HIPC)High incomeHondurasHong Kong SAR, ChinaHungaryIBRD onlyIcelandIDA & IBRD totalIDA blendIDA onlyIDA totalIndiaIndonesiaIran, Islamic Rep.IraqIrelandItalyJamaicaJapanJordanKazakhstanKenyaKiribatiKorea, Rep.KosovoKuwaitKyrgyz RepublicLao PDRLate-demographic dividendLatin America & Caribbean Latin America & Caribbean (excluding high income)Latin America & the Caribbean (IDA & IBRD countries)LatviaLeast developed countries: UN classificationLebanonLesothoLiberiaLibyaLiechtensteinLithuaniaLow & middle incomeLow incomeLower middle incomeLuxembourgMacao SAR, ChinaMacedonia, FYRMadagascarMalawiMalaysiaMaldivesMaliMaltaMarshall IslandsMauritaniaMauritiusMexicoMicronesia, Fed. Sts.Middle East & North AfricaMiddle East & North Africa (excluding high income)Middle East & North Africa (IDA & IBRD countries)Middle incomeMoldovaMongoliaMontenegroMoroccoMozambiqueMyanmarNamibiaNepalNetherlandsNew CaledoniaNew ZealandNicaraguaNigerNigeriaNorth AmericaNorwayOECD membersOmanOther small statesPacific island small statesPakistanPalauPanamaPapua New GuineaParaguayPeruPhilippinesPolandPortugalPost-demographic dividendPre-demographic dividendPuerto RicoQatarRomaniaRussian FederationRwandaSamoaSao Tome and PrincipeSaudi ArabiaSenegalSerbiaSeychellesSierra LeoneSingaporeSlovak RepublicSloveniaSmall statesSolomon IslandsSouth AfricaSouth AsiaSouth Asia (IDA & IBRD)SpainSri LankaSt. Kitts and NevisSt. LuciaSt. Vincent and the GrenadinesSub-Saharan Africa Sub-Saharan Africa (excluding high income)Sub-Saharan Africa (IDA & IBRD countries)SudanSurinameSwazilandSwedenSwitzerlandSyrian Arab RepublicTajikistanTanzaniaThailandTimor-LesteTogoTongaTrinidad and TobagoTunisiaTurkeyTurkmenistanTuvaluUgandaUkraineUnited Arab EmiratesUnited KingdomUnited StatesUpper middle incomeUruguayUzbekistanVanuatuVenezuela, RBVietnamWest Bank and GazaWorldYemen, Rep.ZambiaZimbabwe Timeline:
This timeline shows a graph from 1988 to 2016 of Turkmenistan. No data until 1987. Number of actual observations by date: 29.
Source name:
World Development Indicators
Source organization:
World Bank national accounts data, and OECD National Accounts data files.
Categories, topics:
Economy & Growth
Last updated:
apr 23, 2017
Indicators value changes by year
Minimum:
390.066 mln
jan 1, 1993
Maximum:
26.406 bln
jan 1, 2015
At the date of observation
Value
Absolute change
Change from previous value
jan 1, 1988
932.544 mln
+932.544 mln
0.0%
jan 1, 1989
1.115 bln
+182.635 mln
19.58%
jan 1, 1990
1.074 bln
-41.254 mln
-3.7%
jan 1, 1991
956.862 mln
-117.062 mln
-10.9%
jan 1, 1992
978.742 mln
+21.88 mln
2.29%
jan 1, 1993
390.066 mln
-588.676 mln
-60.15%
jan 1, 1994
1.901 bln
+1.51 bln
387.24%
jan 1, 1995
1.148 bln
-752.164 mln
-39.58%
jan 1, 1996
1.467 bln
+318.484 mln
27.73%
jan 1, 1997
1.551 bln
+84.414 mln
5.75%
jan 1, 1998
1.103 bln
-447.948 mln
-28.88%
jan 1, 1999
1.057 bln
-46.171 mln
-4.18%
jan 1, 2000
1.07 bln
+12.5 mln
1.18%
jan 1, 2001
1.193 bln
+123.004 mln
11.5%
jan 1, 2002
1.484 bln
+290.939 mln
24.39%
jan 1, 2003
1.798 bln
+314.513 mln
21.2%
jan 1, 2004
2.324 bln
+526.238 mln
29.27%
jan 1, 2005
2.59 bln
+265.446 mln
11.42%
jan 1, 2006
3.004 bln
+413.82 mln
15.98%
jan 1, 2007
3.678 bln
+674.409 mln
22.45%
jan 1, 2008
4.776 bln
+1.098 bln
29.84%
jan 1, 2009
11.668 bln
+6.892 bln
144.33%
jan 1, 2010
12.313 bln
+644.537 mln
5.52%
jan 1, 2011
13.354 bln
+1.041 bln
8.46%
jan 1, 2012
19.256 bln
+5.902 bln
44.2%
jan 1, 2013
23.412 bln
+4.156 bln
21.59%
jan 1, 2014
24.862 bln
+1.45 bln
6.19%
jan 1, 2015
26.406 bln
+1.544 bln
6.21%
jan 1, 2016
20.394 bln
-6.012 bln
-22.77%
Ranking of countries by current statistics by years


Comments: