29
/
en
AIzaSyAYiBZKx7MnpbEhh9jyipgxe19OcubqV5w
April 1, 2024
144526
Guatemala
GTM
true
2
1
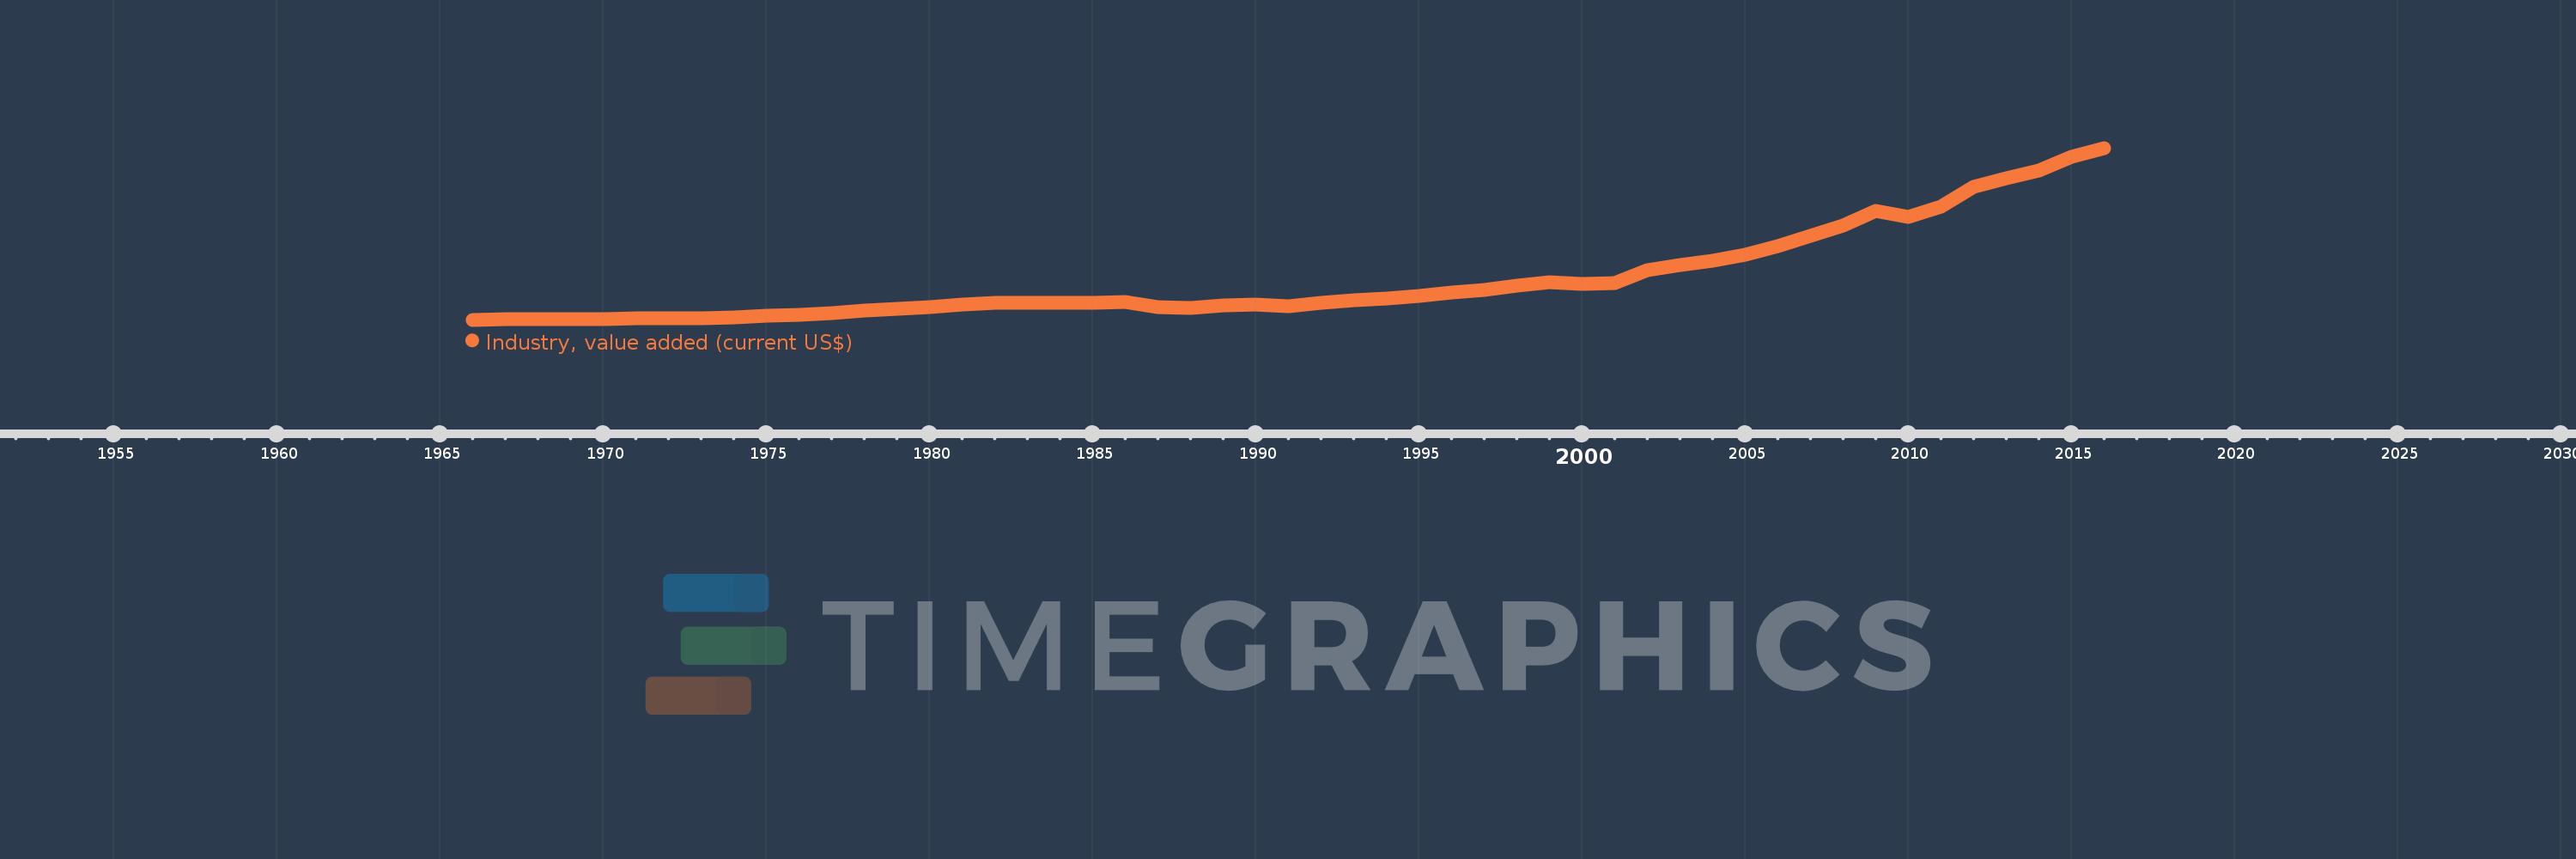
Industry, value added (current US$)
2016,2015,2014,2013,2012,2011,2010,2009,2008,2007,2006,2005,2004,2003,2002,2001,2000,1999,1998,1997,1996,1995,1994,1993,1992,1991,1990,1989,1988,1987,1986,1985,1984,1983,1982,1981,1980,1979,1978,1977,1976,1975,1974,1973,1972,1971,1970,1969,1968,1967,1966
This statistics in other country:
AfghanistanAlbaniaAlgeriaAndorraAngolaAntigua and BarbudaArab WorldArgentinaArmeniaArubaAustraliaAustriaAzerbaijanBahamas, TheBahrainBangladeshBarbadosBelarusBelgiumBelizeBeninBermudaBhutanBoliviaBosnia and HerzegovinaBotswanaBrazilBrunei DarussalamBulgariaBurkina FasoBurundiCabo VerdeCambodiaCameroonCanadaCaribbean small statesCayman IslandsCentral African RepublicCentral Europe and the BalticsChadChileChinaColombiaComorosCongo, Dem. Rep.Congo, Rep.Costa RicaCote d'IvoireCroatiaCubaCyprusCzech RepublicDenmarkDjiboutiDominicaDominican RepublicEarly-demographic dividendEast Asia & PacificEast Asia & Pacific (excluding high income)East Asia & Pacific (IDA & IBRD countries)EcuadorEgypt, Arab Rep.El SalvadorEquatorial GuineaEritreaEstoniaEthiopiaEuro areaEurope & Central AsiaEurope & Central Asia (excluding high income)Europe & Central Asia (IDA & IBRD countries)European UnionFijiFinlandFragile and conflict affected situationsFranceGabonGambia, TheGeorgiaGermanyGhanaGreeceGrenadaGuatemalaGuineaGuinea-BissauGuyanaHeavily indebted poor countries (HIPC)High incomeHondurasHong Kong SAR, ChinaHungaryIBRD onlyIcelandIDA & IBRD totalIDA blendIDA onlyIDA totalIndiaIndonesiaIran, Islamic Rep.IraqIrelandItalyJamaicaJapanJordanKazakhstanKenyaKiribatiKorea, Rep.KosovoKuwaitKyrgyz RepublicLao PDRLate-demographic dividendLatin America & Caribbean Latin America & Caribbean (excluding high income)Latin America & the Caribbean (IDA & IBRD countries)LatviaLeast developed countries: UN classificationLebanonLesothoLiberiaLibyaLiechtensteinLithuaniaLow & middle incomeLow incomeLower middle incomeLuxembourgMacao SAR, ChinaMacedonia, FYRMadagascarMalawiMalaysiaMaldivesMaliMaltaMarshall IslandsMauritaniaMauritiusMexicoMicronesia, Fed. Sts.Middle East & North AfricaMiddle East & North Africa (excluding high income)Middle East & North Africa (IDA & IBRD countries)Middle incomeMoldovaMongoliaMontenegroMoroccoMozambiqueMyanmarNamibiaNepalNetherlandsNew CaledoniaNew ZealandNicaraguaNigerNigeriaNorth AmericaNorwayOECD membersOmanOther small statesPacific island small statesPakistanPalauPanamaPapua New GuineaParaguayPeruPhilippinesPolandPortugalPost-demographic dividendPre-demographic dividendPuerto RicoQatarRomaniaRussian FederationRwandaSamoaSao Tome and PrincipeSaudi ArabiaSenegalSerbiaSeychellesSierra LeoneSingaporeSlovak RepublicSloveniaSmall statesSolomon IslandsSouth AfricaSouth AsiaSouth Asia (IDA & IBRD)SpainSri LankaSt. Kitts and NevisSt. LuciaSt. Vincent and the GrenadinesSub-Saharan Africa Sub-Saharan Africa (excluding high income)Sub-Saharan Africa (IDA & IBRD countries)SudanSurinameSwazilandSwedenSwitzerlandSyrian Arab RepublicTajikistanTanzaniaThailandTimor-LesteTogoTongaTrinidad and TobagoTunisiaTurkeyTurkmenistanTuvaluUgandaUkraineUnited Arab EmiratesUnited KingdomUnited StatesUpper middle incomeUruguayUzbekistanVanuatuVenezuela, RBVietnamWest Bank and GazaWorldYemen, Rep.ZambiaZimbabwe Timeline:
This timeline shows a graph from 1966 to 2016 of Guatemala. No data until 1965. Number of actual observations by date: 51.
Source name:
World Development Indicators
Source organization:
World Bank national accounts data, and OECD National Accounts data files.
Categories, topics:
Economy & Growth
Last updated:
apr 23, 2017
Indicators value changes by year
Minimum:
226.943 mln
jan 1, 1966
Maximum:
16.907 bln
jan 1, 2016
At the date of observation
Value
Absolute change
Change from previous value
jan 1, 1966
226.943 mln
+226.943 mln
0.0%
jan 1, 1967
248.009 mln
+21.066 mln
9.28%
jan 1, 1968
269.767 mln
+21.758 mln
8.77%
jan 1, 1969
300.477 mln
+30.71 mln
11.38%
jan 1, 1970
327.017 mln
+26.541 mln
8.83%
jan 1, 1971
355.374 mln
+28.356 mln
8.67%
jan 1, 1972
373.408 mln
+18.035 mln
5.07%
jan 1, 1973
394.278 mln
+20.87 mln
5.59%
jan 1, 1974
493.257 mln
+98.979 mln
25.1%
jan 1, 1975
591.968 mln
+98.711 mln
20.01%
jan 1, 1976
674.26 mln
+82.292 mln
13.9%
jan 1, 1977
877.552 mln
+203.292 mln
30.15%
jan 1, 1978
1.144 bln
+266.918 mln
30.42%
jan 1, 1979
1.287 bln
+142.287 mln
12.43%
jan 1, 1980
1.486 bln
+199.006 mln
15.47%
jan 1, 1981
1.732 bln
+246.521 mln
16.59%
jan 1, 1982
1.872 bln
+139.545 mln
8.06%
jan 1, 1983
1.851 bln
-20.659 mln
-1.1%
jan 1, 1984
1.856 bln
+4.458 mln
0.24%
jan 1, 1985
1.871 bln
+15.289 mln
0.82%
jan 1, 1986
1.912 bln
+41.294 mln
2.21%
jan 1, 1987
1.453 bln
-459.276 mln
-24.02%
jan 1, 1988
1.406 bln
-46.936 mln
-3.23%
jan 1, 1989
1.583 bln
+177.282 mln
12.61%
jan 1, 1990
1.691 bln
+107.698 mln
6.8%
jan 1, 1991
1.514 bln
-177.192 mln
-10.48%
jan 1, 1992
1.841 bln
+327.499 mln
21.63%
jan 1, 1993
2.089 bln
+247.845 mln
13.46%
jan 1, 1994
2.266 bln
+177.134 mln
8.48%
jan 1, 1995
2.556 bln
+289.555 mln
12.78%
jan 1, 1996
2.882 bln
+325.682 mln
12.74%
jan 1, 1997
3.086 bln
+204.161 mln
7.09%
jan 1, 1998
3.553 bln
+467.775 mln
15.16%
jan 1, 1999
3.878 bln
+324.562 mln
9.13%
jan 1, 2000
3.686 bln
-192.339 mln
-4.96%
jan 1, 2001
3.817 bln
+131.832 mln
3.58%
jan 1, 2002
5.032 bln
+1.215 bln
31.82%
jan 1, 2003
5.557 bln
+524.979 mln
10.43%
jan 1, 2004
5.921 bln
+363.783 mln
6.55%
jan 1, 2005
6.574 bln
+653.011 mln
11.03%
jan 1, 2006
7.387 bln
+813.064 mln
12.37%
jan 1, 2007
8.408 bln
+1.021 bln
13.82%
jan 1, 2008
9.36 bln
+951.766 mln
11.32%
jan 1, 2009
10.826 bln
+1.466 bln
15.66%
jan 1, 2010
10.219 bln
-606.916 mln
-5.61%
jan 1, 2011
11.183 bln
+963.441 mln
9.43%
jan 1, 2012
13.099 bln
+1.916 bln
17.13%
jan 1, 2013
13.948 bln
+848.652 mln
6.48%
jan 1, 2014
14.714 bln
+766.245 mln
5.49%
jan 1, 2015
16.052 bln
+1.339 bln
9.1%
jan 1, 2016
16.907 bln
+854.106 mln
5.32%
Ranking of countries by current statistics by years


Comments: