29
/
en
AIzaSyAYiBZKx7MnpbEhh9jyipgxe19OcubqV5w
April 1, 2024
105017
Chile
CHL
true
2
1
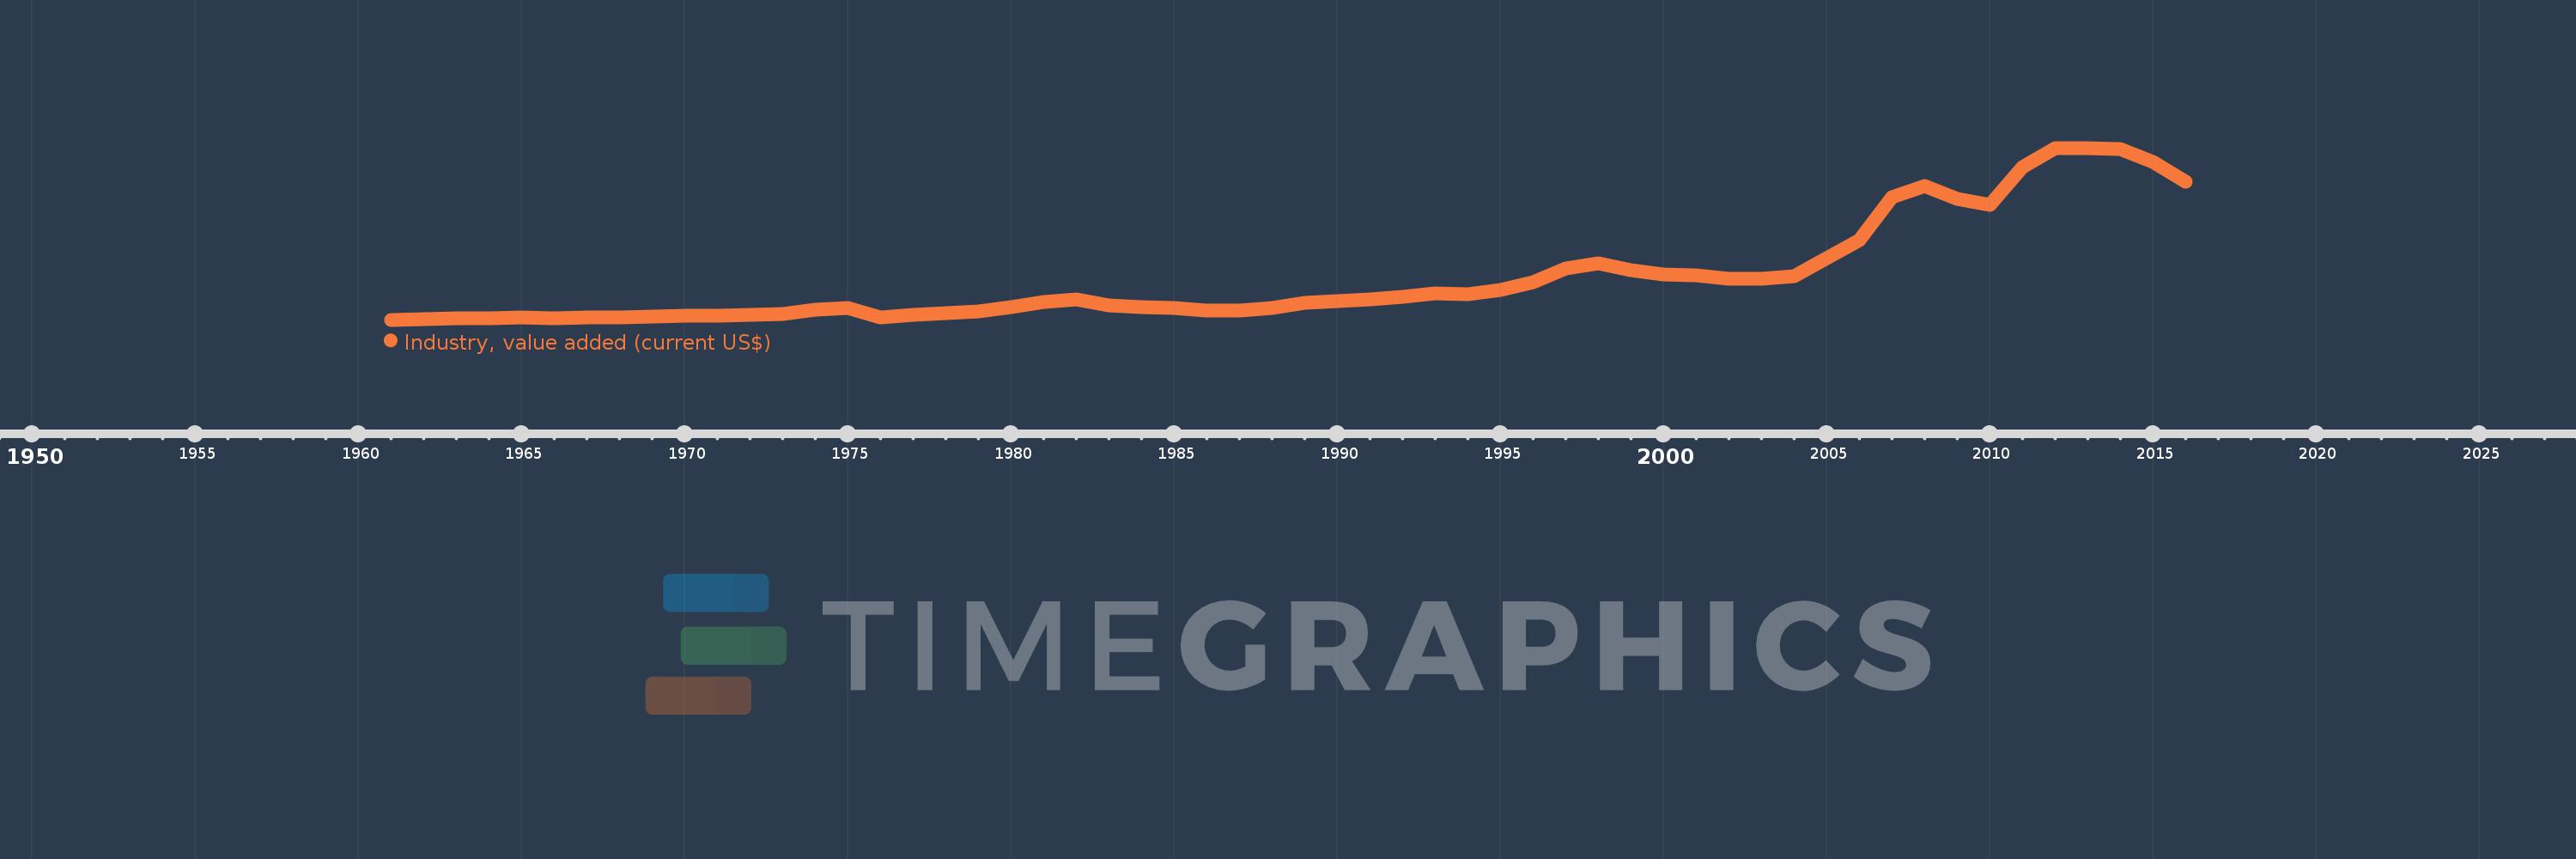
Industry, value added (current US$)
2016,2015,2014,2013,2012,2011,2010,2009,2008,2007,2006,2005,2004,2003,2002,2001,2000,1999,1998,1997,1996,1995,1994,1993,1992,1991,1990,1989,1988,1987,1986,1985,1984,1983,1982,1981,1980,1979,1978,1977,1976,1975,1974,1973,1972,1971,1970,1969,1968,1967,1966,1965,1964,1963,1962,1961
This statistics in other country:
AfghanistanAlbaniaAlgeriaAndorraAngolaAntigua and BarbudaArab WorldArgentinaArmeniaArubaAustraliaAustriaAzerbaijanBahamas, TheBahrainBangladeshBarbadosBelarusBelgiumBelizeBeninBermudaBhutanBoliviaBosnia and HerzegovinaBotswanaBrazilBrunei DarussalamBulgariaBurkina FasoBurundiCabo VerdeCambodiaCameroonCanadaCaribbean small statesCayman IslandsCentral African RepublicCentral Europe and the BalticsChadChileChinaColombiaComorosCongo, Dem. Rep.Congo, Rep.Costa RicaCote d'IvoireCroatiaCubaCyprusCzech RepublicDenmarkDjiboutiDominicaDominican RepublicEarly-demographic dividendEast Asia & PacificEast Asia & Pacific (excluding high income)East Asia & Pacific (IDA & IBRD countries)EcuadorEgypt, Arab Rep.El SalvadorEquatorial GuineaEritreaEstoniaEthiopiaEuro areaEurope & Central AsiaEurope & Central Asia (excluding high income)Europe & Central Asia (IDA & IBRD countries)European UnionFijiFinlandFragile and conflict affected situationsFranceGabonGambia, TheGeorgiaGermanyGhanaGreeceGrenadaGuatemalaGuineaGuinea-BissauGuyanaHeavily indebted poor countries (HIPC)High incomeHondurasHong Kong SAR, ChinaHungaryIBRD onlyIcelandIDA & IBRD totalIDA blendIDA onlyIDA totalIndiaIndonesiaIran, Islamic Rep.IraqIrelandItalyJamaicaJapanJordanKazakhstanKenyaKiribatiKorea, Rep.KosovoKuwaitKyrgyz RepublicLao PDRLate-demographic dividendLatin America & Caribbean Latin America & Caribbean (excluding high income)Latin America & the Caribbean (IDA & IBRD countries)LatviaLeast developed countries: UN classificationLebanonLesothoLiberiaLibyaLiechtensteinLithuaniaLow & middle incomeLow incomeLower middle incomeLuxembourgMacao SAR, ChinaMacedonia, FYRMadagascarMalawiMalaysiaMaldivesMaliMaltaMarshall IslandsMauritaniaMauritiusMexicoMicronesia, Fed. Sts.Middle East & North AfricaMiddle East & North Africa (excluding high income)Middle East & North Africa (IDA & IBRD countries)Middle incomeMoldovaMongoliaMontenegroMoroccoMozambiqueMyanmarNamibiaNepalNetherlandsNew CaledoniaNew ZealandNicaraguaNigerNigeriaNorth AmericaNorwayOECD membersOmanOther small statesPacific island small statesPakistanPalauPanamaPapua New GuineaParaguayPeruPhilippinesPolandPortugalPost-demographic dividendPre-demographic dividendPuerto RicoQatarRomaniaRussian FederationRwandaSamoaSao Tome and PrincipeSaudi ArabiaSenegalSerbiaSeychellesSierra LeoneSingaporeSlovak RepublicSloveniaSmall statesSolomon IslandsSouth AfricaSouth AsiaSouth Asia (IDA & IBRD)SpainSri LankaSt. Kitts and NevisSt. LuciaSt. Vincent and the GrenadinesSub-Saharan Africa Sub-Saharan Africa (excluding high income)Sub-Saharan Africa (IDA & IBRD countries)SudanSurinameSwazilandSwedenSwitzerlandSyrian Arab RepublicTajikistanTanzaniaThailandTimor-LesteTogoTongaTrinidad and TobagoTunisiaTurkeyTurkmenistanTuvaluUgandaUkraineUnited Arab EmiratesUnited KingdomUnited StatesUpper middle incomeUruguayUzbekistanVanuatuVenezuela, RBVietnamWest Bank and GazaWorldYemen, Rep.ZambiaZimbabwe Timeline:
This timeline shows a graph from 1961 to 2016 of Chile. No data until 1960. Number of actual observations by date: 56.
Source name:
World Development Indicators
Source organization:
World Bank national accounts data, and OECD National Accounts data files.
Categories, topics:
Economy & Growth
Last updated:
apr 23, 2017
Indicators value changes by year
Minimum:
1.364 bln
jan 1, 1961
Maximum:
89.116 bln
jan 1, 2012
At the date of observation
Value
Absolute change
Change from previous value
jan 1, 1961
1.364 bln
+1.364 bln
0.0%
jan 1, 1962
1.545 bln
+181.818 mln
13.33%
jan 1, 1963
1.909 bln
+363.636 mln
23.53%
jan 1, 1964
2.063 bln
+153.409 mln
8.04%
jan 1, 1965
2.348 bln
+285.326 mln
13.83%
jan 1, 1966
2.281 bln
-66.576 mln
-2.84%
jan 1, 1967
2.667 bln
+385.417 mln
16.89%
jan 1, 1968
2.667 bln
0.0
0.0%
jan 1, 1969
2.812 bln
+144.928 mln
5.43%
jan 1, 1970
3.419 bln
+607.01 mln
21.59%
jan 1, 1971
3.602 bln
+183.165 mln
5.36%
jan 1, 1972
4.016 bln
+414.624 mln
11.51%
jan 1, 1973
4.26 bln
+243.222 mln
6.06%
jan 1, 1974
6.564 bln
+2.305 bln
54.1%
jan 1, 1975
7.562 bln
+998.17 mln
15.21%
jan 1, 1976
2.753 bln
-4.81 bln
-63.6%
jan 1, 1977
3.941 bln
+1.189 bln
43.18%
jan 1, 1978
4.824 bln
+883.171 mln
22.41%
jan 1, 1979
5.543 bln
+718.979 mln
14.9%
jan 1, 1980
7.731 bln
+2.188 bln
39.47%
jan 1, 1981
10.286 bln
+2.554 bln
33.04%
jan 1, 1982
11.96 bln
+1.674 bln
16.27%
jan 1, 1983
8.613 bln
-3.347 bln
-27.98%
jan 1, 1984
7.669 bln
-944.359 mln
-10.96%
jan 1, 1985
7.407 bln
-261.2 mln
-3.41%
jan 1, 1986
5.997 bln
-1.41 bln
-19.04%
jan 1, 1987
6.267 bln
+269.979 mln
4.5%
jan 1, 1988
7.492 bln
+1.225 bln
19.55%
jan 1, 1989
9.95 bln
+2.458 bln
32.81%
jan 1, 1990
10.999 bln
+1.048 bln
10.53%
jan 1, 1991
11.891 bln
+892.727 mln
8.12%
jan 1, 1992
12.95 bln
+1.058 bln
8.9%
jan 1, 1993
14.769 bln
+1.819 bln
14.05%
jan 1, 1994
14.56 bln
-209.045 mln
-1.42%
jan 1, 1995
16.476 bln
+1.917 bln
13.16%
jan 1, 1996
20.671 bln
+4.195 bln
25.46%
jan 1, 1997
27.552 bln
+6.881 bln
33.29%
jan 1, 1998
30.052 bln
+2.5 bln
9.07%
jan 1, 1999
26.798 bln
-3.254 bln
-10.83%
jan 1, 2000
24.689 bln
-2.108 bln
-7.87%
jan 1, 2001
23.985 bln
-703.954 mln
-2.85%
jan 1, 2002
22.393 bln
-1.592 bln
-6.64%
jan 1, 2003
22.101 bln
-292.896 mln
-1.31%
jan 1, 2004
23.404 bln
+1.303 bln
5.9%
jan 1, 2005
32.656 bln
+9.252 bln
39.53%
jan 1, 2006
42.029 bln
+9.373 bln
28.7%
jan 1, 2007
64.03 bln
+22.001 bln
52.35%
jan 1, 2008
69.668 bln
+5.639 bln
8.81%
jan 1, 2009
63.28 bln
-6.389 bln
-9.17%
jan 1, 2010
60.206 bln
-3.074 bln
-4.86%
jan 1, 2011
79.185 bln
+18.979 bln
31.52%
jan 1, 2012
89.116 bln
+9.93 bln
12.54%
jan 1, 2013
88.849 bln
-266.927 mln
-0.3%
jan 1, 2014
88.603 bln
-245.451 mln
-0.28%
jan 1, 2015
81.783 bln
-6.82 bln
-7.7%
jan 1, 2016
72.042 bln
-9.741 bln
-11.91%
Ranking of countries by current statistics by years


Comments: