29
/
en
AIzaSyAYiBZKx7MnpbEhh9jyipgxe19OcubqV5w
April 1, 2024
132134
Fiji
FJI
true
2
1
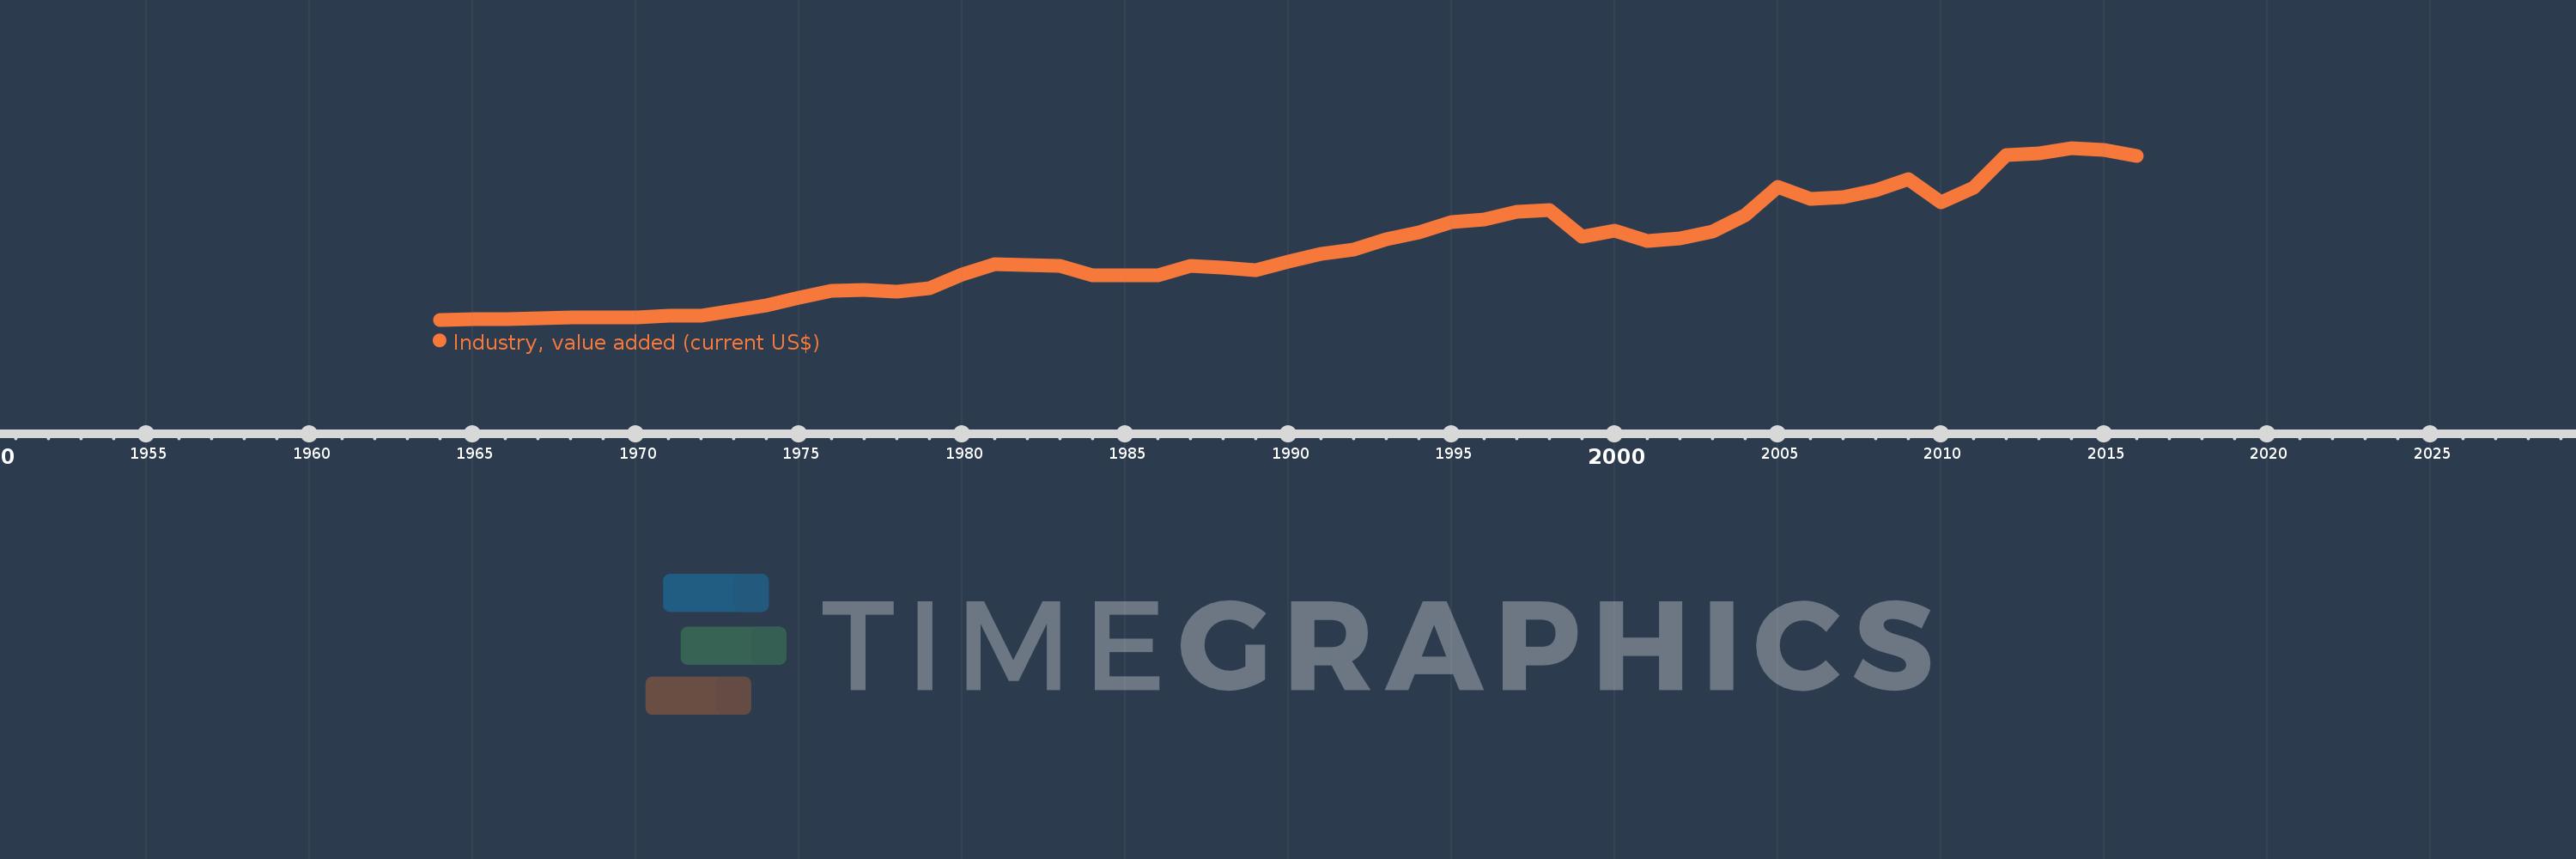
Industry, value added (current US$)
2016,2015,2014,2013,2012,2011,2010,2009,2008,2007,2006,2005,2004,2003,2002,2001,2000,1999,1998,1997,1996,1995,1994,1993,1992,1991,1990,1989,1988,1987,1986,1985,1984,1983,1982,1981,1980,1979,1978,1977,1976,1975,1974,1973,1972,1971,1970,1969,1968,1967,1966,1965,1964
This statistics in other country:
AfghanistanAlbaniaAlgeriaAndorraAngolaAntigua and BarbudaArab WorldArgentinaArmeniaArubaAustraliaAustriaAzerbaijanBahamas, TheBahrainBangladeshBarbadosBelarusBelgiumBelizeBeninBermudaBhutanBoliviaBosnia and HerzegovinaBotswanaBrazilBrunei DarussalamBulgariaBurkina FasoBurundiCabo VerdeCambodiaCameroonCanadaCaribbean small statesCayman IslandsCentral African RepublicCentral Europe and the BalticsChadChileChinaColombiaComorosCongo, Dem. Rep.Congo, Rep.Costa RicaCote d'IvoireCroatiaCubaCyprusCzech RepublicDenmarkDjiboutiDominicaDominican RepublicEarly-demographic dividendEast Asia & PacificEast Asia & Pacific (excluding high income)East Asia & Pacific (IDA & IBRD countries)EcuadorEgypt, Arab Rep.El SalvadorEquatorial GuineaEritreaEstoniaEthiopiaEuro areaEurope & Central AsiaEurope & Central Asia (excluding high income)Europe & Central Asia (IDA & IBRD countries)European UnionFijiFinlandFragile and conflict affected situationsFranceGabonGambia, TheGeorgiaGermanyGhanaGreeceGrenadaGuatemalaGuineaGuinea-BissauGuyanaHeavily indebted poor countries (HIPC)High incomeHondurasHong Kong SAR, ChinaHungaryIBRD onlyIcelandIDA & IBRD totalIDA blendIDA onlyIDA totalIndiaIndonesiaIran, Islamic Rep.IraqIrelandItalyJamaicaJapanJordanKazakhstanKenyaKiribatiKorea, Rep.KosovoKuwaitKyrgyz RepublicLao PDRLate-demographic dividendLatin America & Caribbean Latin America & Caribbean (excluding high income)Latin America & the Caribbean (IDA & IBRD countries)LatviaLeast developed countries: UN classificationLebanonLesothoLiberiaLibyaLiechtensteinLithuaniaLow & middle incomeLow incomeLower middle incomeLuxembourgMacao SAR, ChinaMacedonia, FYRMadagascarMalawiMalaysiaMaldivesMaliMaltaMarshall IslandsMauritaniaMauritiusMexicoMicronesia, Fed. Sts.Middle East & North AfricaMiddle East & North Africa (excluding high income)Middle East & North Africa (IDA & IBRD countries)Middle incomeMoldovaMongoliaMontenegroMoroccoMozambiqueMyanmarNamibiaNepalNetherlandsNew CaledoniaNew ZealandNicaraguaNigerNigeriaNorth AmericaNorwayOECD membersOmanOther small statesPacific island small statesPakistanPalauPanamaPapua New GuineaParaguayPeruPhilippinesPolandPortugalPost-demographic dividendPre-demographic dividendPuerto RicoQatarRomaniaRussian FederationRwandaSamoaSao Tome and PrincipeSaudi ArabiaSenegalSerbiaSeychellesSierra LeoneSingaporeSlovak RepublicSloveniaSmall statesSolomon IslandsSouth AfricaSouth AsiaSouth Asia (IDA & IBRD)SpainSri LankaSt. Kitts and NevisSt. LuciaSt. Vincent and the GrenadinesSub-Saharan Africa Sub-Saharan Africa (excluding high income)Sub-Saharan Africa (IDA & IBRD countries)SudanSurinameSwazilandSwedenSwitzerlandSyrian Arab RepublicTajikistanTanzaniaThailandTimor-LesteTogoTongaTrinidad and TobagoTunisiaTurkeyTurkmenistanTuvaluUgandaUkraineUnited Arab EmiratesUnited KingdomUnited StatesUpper middle incomeUruguayUzbekistanVanuatuVenezuela, RBVietnamWest Bank and GazaWorldYemen, Rep.ZambiaZimbabwe Timeline:
This timeline shows a graph from 1964 to 2016 of Fiji. No data until 1963. Number of actual observations by date: 53.
Source name:
World Development Indicators
Source organization:
World Bank national accounts data, and OECD National Accounts data files.
Categories, topics:
Economy & Growth
Last updated:
apr 23, 2017
Indicators value changes by year
Minimum:
29.593 mln
jan 1, 1964
Maximum:
684.599 mln
jan 1, 2014
At the date of observation
Value
Absolute change
Change from previous value
jan 1, 1964
29.593 mln
+29.593 mln
0.0%
jan 1, 1965
33.119 mln
+3.526 mln
11.91%
jan 1, 1966
33.371 mln
+251.857K
0.76%
jan 1, 1967
33.845 mln
+473.88K
1.42%
jan 1, 1968
37.548 mln
+3.703 mln
10.94%
jan 1, 1969
37.902 mln
+354.031K
0.94%
jan 1, 1970
38.541 mln
+638.504K
1.68%
jan 1, 1971
45.627 mln
+7.086 mln
18.39%
jan 1, 1972
46.533 mln
+906.875K
1.99%
jan 1, 1973
63.5 mln
+16.966 mln
36.46%
jan 1, 1974
83.858 mln
+20.358 mln
32.06%
jan 1, 1975
112.959 mln
+29.101 mln
34.7%
jan 1, 1976
139.92 mln
+26.96 mln
23.87%
jan 1, 1977
142.587 mln
+2.667 mln
1.91%
jan 1, 1978
136.691 mln
-5.896 mln
-4.14%
jan 1, 1979
148.914 mln
+12.223 mln
8.94%
jan 1, 1980
200.909 mln
+51.996 mln
34.92%
jan 1, 1981
242.421 mln
+41.511 mln
20.66%
jan 1, 1982
237.07 mln
-5.351 mln
-2.21%
jan 1, 1983
233.337 mln
-3.733 mln
-1.57%
jan 1, 1984
200.054 mln
-33.282 mln
-14.26%
jan 1, 1985
199.796 mln
-258.219K
-0.13%
jan 1, 1986
199.055 mln
-740.73K
-0.37%
jan 1, 1987
235.105 mln
+36.049 mln
18.11%
jan 1, 1988
226.774 mln
-8.331 mln
-3.54%
jan 1, 1989
217.256 mln
-9.518 mln
-4.2%
jan 1, 1990
252.698 mln
+35.442 mln
16.31%
jan 1, 1991
281.949 mln
+29.251 mln
11.58%
jan 1, 1992
296.866 mln
+14.916 mln
5.29%
jan 1, 1993
336.508 mln
+39.642 mln
13.35%
jan 1, 1994
364.19 mln
+27.682 mln
8.23%
jan 1, 1995
400.989 mln
+36.799 mln
10.1%
jan 1, 1996
410.21 mln
+9.222 mln
2.3%
jan 1, 1997
442.172 mln
+31.962 mln
7.79%
jan 1, 1998
446.284 mln
+4.112 mln
0.93%
jan 1, 1999
346.487 mln
-99.797 mln
-22.36%
jan 1, 2000
368.4 mln
+21.913 mln
6.32%
jan 1, 2001
328.723 mln
-39.677 mln
-10.77%
jan 1, 2002
340.81 mln
+12.087 mln
3.68%
jan 1, 2003
364.834 mln
+24.024 mln
7.05%
jan 1, 2004
429.169 mln
+64.335 mln
17.63%
jan 1, 2005
535.16 mln
+105.992 mln
24.7%
jan 1, 2006
490.317 mln
-44.843 mln
-8.38%
jan 1, 2007
497.19 mln
+6.872 mln
1.4%
jan 1, 2008
522.991 mln
+25.802 mln
5.19%
jan 1, 2009
566.743 mln
+43.752 mln
8.37%
jan 1, 2010
478.757 mln
-87.986 mln
-15.52%
jan 1, 2011
533.025 mln
+54.268 mln
11.34%
jan 1, 2012
657.26 mln
+124.234 mln
23.31%
jan 1, 2013
664.227 mln
+6.967 mln
1.06%
jan 1, 2014
684.599 mln
+20.372 mln
3.07%
jan 1, 2015
677.506 mln
-7.092 mln
-1.04%
jan 1, 2016
655.047 mln
-22.459 mln
-3.31%
Ranking of countries by current statistics by years


Comments: